
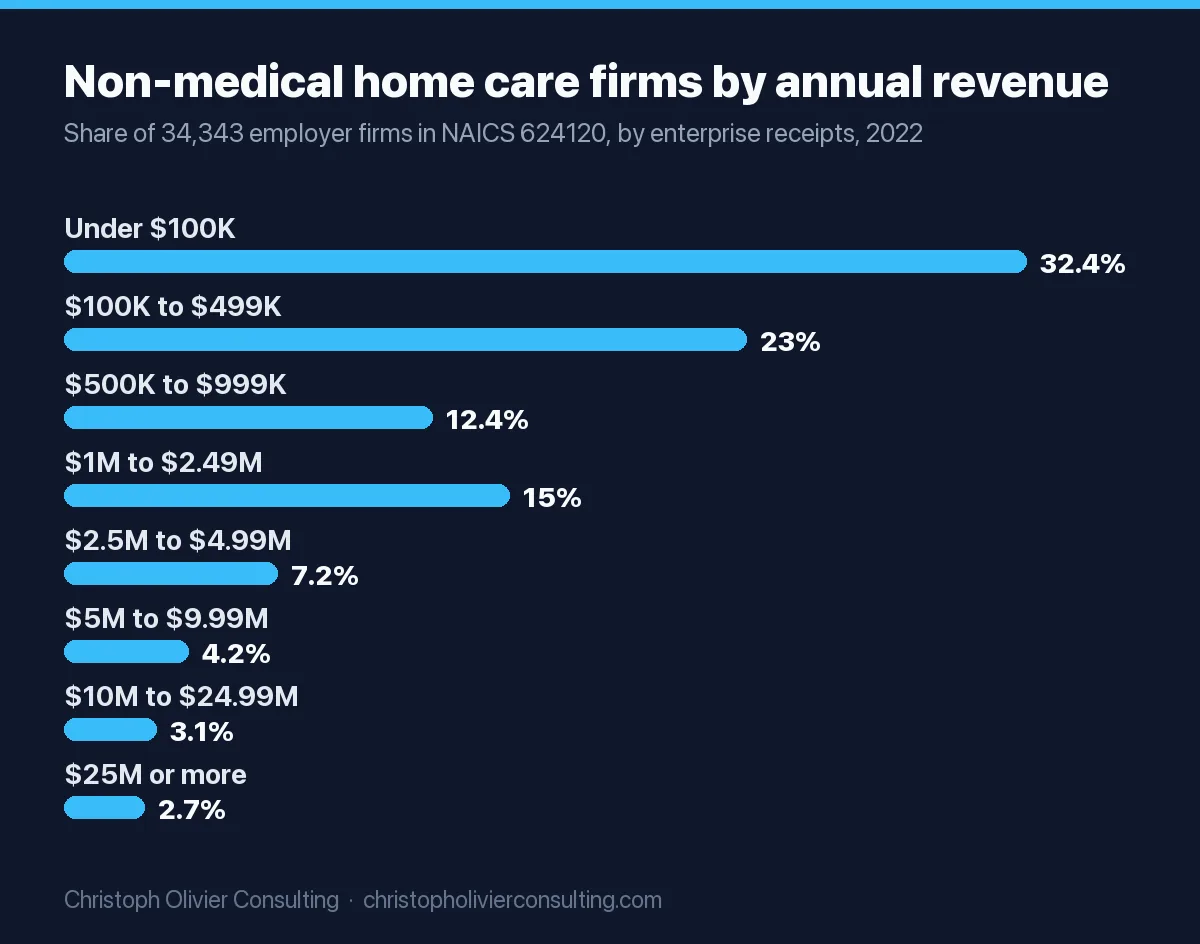
The average US non-medical home care company took in $2,092,588 in 2022, but that number is pulled up by a few hundred very large operators. Census Bureau data shows that more than half of the 34,343 employer firms in NAICS 624120 (services for the elderly and persons with disabilities, the code for non-medical home care) had receipts under $500,000. Firms with fewer than 20 employees averaged $323,829.
Home health agencies (NAICS 621610, skilled nursing in the home) are bigger: $4,019,803 on average across 28,198 firms. Profit is thinner than most startup guides suggest. The public operators report gross margins of about 28% to 33% and net margins in single digits. Below are the Census averages by firm size, the margins from audited 10-Ks, an owner earnings table, and a worksheet you can run on your own agency.
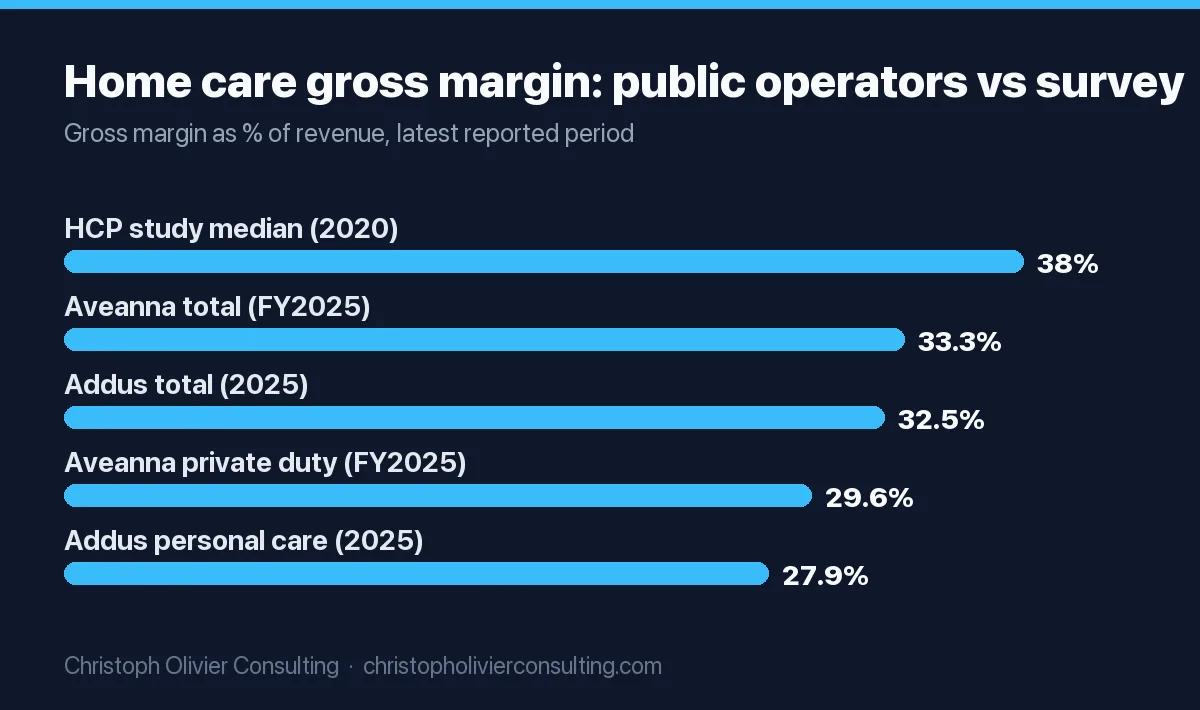
Short answer: Census SUSB data for 2022 puts average revenue at $2.09 million per non-medical home care firm and $4.02 million per home health firm, but the typical (median) non-medical firm falls in the $100,000 to $499,999 receipts band. Addus HomeCare’s personal care segment ran a 27.9% gross margin in 2025, and Home Care Pulse’s 2020 study found a 38% median gross margin. Net margins of roughly 7% to 10% are what the published data supports.
Home care agency average revenue by size (Census, 2022)
The best public count of home care revenue is the Census Bureau’s Statistics of US Businesses (SUSB) 2022 table by enterprise receipts size, released April 10, 2025. It covers every employer firm, so it includes the one-office agency and Addus alike. I divided total receipts by the number of firms in each band to get the averages below. The payroll column is annual payroll as a share of receipts, also my calculation from the same table.
| Annual receipts band | Non-medical firms (624120) | Share of firms | Avg revenue per firm | Payroll as % of revenue | Home health firms (621610) | Avg revenue per firm |
|---|---|---|---|---|---|---|
| Under $100K | 11,134 | 32.4% | $31,018 | 58.7% | 6,361 | $36,624 |
| $100K to $499K | 7,906 | 23.0% | $261,931 | 53.6% | 7,099 | $263,377 |
| $500K to $999K | 4,267 | 12.4% | $720,981 | 54.5% | 3,866 | $731,861 |
| $1M to $2.49M | 5,162 | 15.0% | $1,583,921 | 56.8% | 5,218 | $1,604,158 |
| $2.5M to $4.99M | 2,468 | 7.2% | $3,315,495 | 56.8% | 2,560 | $3,450,420 |
| $5M to $9.99M | 1,428 | 4.2% | $5,856,203 | 57.4% | 1,335 | $6,790,001 |
| $10M to $24.99M | 1,054 | 3.1% | $10,134,933 | 55.3% | 837 | $13,749,651 |
| $25M to $99.99M | 705 | 2.1% | $22,491,332 | 49.8% | 473 | $30,535,400 |
| $100M or more | 219 | 0.6% | $69,009,315 | 36.2% | 449 | $125,163,557 |
| All firms | 34,343 | 100% | $2,092,588 | 50.6% | 28,198 | $4,019,803 |
Source: US Census Bureau, SUSB 2022, US 6-digit NAICS by enterprise receipts size. Bands of $5M and up merge several Census bands. Averages and percentages are my calculations.
Why the average misleads
Count the firms from the top of the table down and you hit the halfway mark inside the $100K to $499K band for non-medical care (55.4% of firms are below $500K) and inside the $500K to $999K band for home health (61.4% are below $1M). Meanwhile the 219 non-medical firms with $100M or more in receipts took 21.0% of all revenue in the code, and the 449 largest home health firms took 49.6%. If you are planning a startup, compare yourself with the band you will actually sit in, not with $2.09 million.
Revenue by number of employees
Most owners know their headcount better than their revenue band. The same SUSB release has a file by employment size (US rows used here). Employment is counted in mid-March, and part-time caregivers count as one employee each.
| Employees | Non-medical firms (624120) | Avg revenue per firm | Home health firms (621610) | Avg revenue per firm |
|---|---|---|---|---|
| 0 to 4 | 15,519 | $134,508 | 11,187 | $242,470 |
| 5 to 9 | 3,777 | $501,503 | 3,386 | $660,235 |
| 10 to 19 | 3,787 | $922,455 | 3,828 | $1,118,957 |
| 20 to 49 | 4,961 | $1,679,745 | 4,726 | $2,090,293 |
| 50 to 99 | 2,831 | $3,055,381 | 2,323 | $4,157,881 |
| 100 to 499 | 2,744 | $9,188,986 | 1,983 | $10,545,427 |
| 500 or more | 724 | $30,653,651 | 765 | $83,228,652 |
Source: US Census Bureau, SUSB 2022, detailed employment sizes. Averages are my calculations (receipts divided by firms).
Non medical home care business revenue vs home health
The two codes are different businesses. Under the 2022 NAICS definition of 624120, firms provide non-medical home care or homemaker services, companionship and day care for the elderly or people with disabilities. The code also holds adult day care centers and senior centers, so not every one of the 34,343 firms is a home care agency. NAICS 621610 requires skilled nursing in the home, and covers Medicare-certified home health agencies, visiting nurse associations and in-home hospice. If you run a private-pay companion and personal care agency, 624120 is your benchmark.
Is a home care business profitable?
Yes, at scale and with discipline, but margins are thin. The cleanest margin data comes from audited 10-K filings and the long-running Home Care Pulse (now Activated Insights) benchmarking study. Here is every figure I could verify, side by side.
| Operator or study | Period | Gross margin | Operating or net margin | Source |
|---|---|---|---|---|
| Addus HomeCare, personal care segment | 2025 | 27.9% | 19.0% segment operating income (before corporate overhead) | Addus 10-K |
| Addus HomeCare, whole company | 2025 | 32.5% | 6.7% net income ($95.9M on $1.42B) | Addus 10-K |
| Aveanna Healthcare, Private Duty Services | Fiscal 2025 | 29.6% | Not reported by segment | Aveanna 10-K |
| Aveanna Healthcare, whole company | Fiscal 2025 | 33.3% | 10.5% operating income | Aveanna 10-K |
| Home Care Pulse study, median agency | 2020 study | 38% | Not given for the median | Activated Insights |
| Home Care Pulse study, agencies with $5M+ revenue | 2020 study | Not given | 9.9% net income from operations | Activated Insights |
Addus is mostly Medicaid personal care: it served about 107,000 consumers from 262 locations in 23 states in 2025, and 39.3% of its revenue came from state and local government agencies, mostly Medicaid. Aveanna’s private duty segment is mostly skilled pediatric nursing, so treat it as a home health comparison. Aveanna’s 2025 net income ($225.0M) included a $118.1M income tax benefit, which is why I show its operating margin instead.
Home care agency profit margin: gross vs net
Gross margin is revenue minus the direct cost of care: caregiver wages, payroll taxes and benefits tied to those hours. Home Care Pulse defines it as total revenue minus direct cost of care, and its 2020 median of 38% meant direct care cost 62% of revenue. Net margin is what is left after office staff, rent, software, insurance, recruiting and marketing. For context, the same study found the median agency spent 4.7% of revenue on sales and marketing and 2.8% on recruiting and retention in 2019. If you are setting your own marketing number, our guide on how to set a marketing budget walks through the method, and profit margin by industry shows how home care compares with other sectors.
Why Medicaid-heavy agencies earn less per hour
Addus’s 10-K shows the squeeze in plain numbers. Its personal care revenue per billable hour fell 6.4% to $25.48 in 2025 after it bought lower-rate businesses. Illinois, its largest market, raised its in-home care rate to $29.63 an hour on January 1, 2025, with a required minimum wage of $18.00 for direct service workers, and to $30.80 with an $18.75 wage floor for 2026. By my math the wage floor alone is 60.9% of the 2026 rate. Add 12% for payroll taxes and workers’ comp (an assumption, these vary by state) and you are at 68.2% before any unbilled travel or training time. Private-pay agencies set their own rates, which is why the 2x rule below is easier to hit outside Medicaid.
How much do home care agency owners make?
No government agency or trade body publishes a verified average for home care owner pay, and the owner income ranges on lender and vendor blogs do not name a dataset. What you can do is combine real revenue levels with real margins. Owner earnings here means net profit before any salary the owner pays themselves, so an owner who also works as the administrator earns that salary on top.
| Agency revenue | Where the revenue figure comes from | At 6.7% (Addus 2025 net margin) | At 9.9% (HCP $5M+ agencies) | At 15% (HCP stretch target) |
|---|---|---|---|---|
| $261,931 | SUSB avg, $100K to $499K band | $17,549 | $25,931 | $39,290 |
| $720,981 | SUSB avg, $500K to $999K band | $48,306 | $71,377 | $108,147 |
| $1,583,921 | SUSB avg, $1M to $2.49M band | $106,123 | $156,808 | $237,588 |
| $3,315,495 | SUSB avg, $2.5M to $4.99M band | $222,138 | $328,234 | $497,324 |
| $6,627,000 | HCP 2020 median, $5M+ agencies | $444,009 | $656,073 | $994,050 |
My calculation: revenue times margin. Revenue levels from Census SUSB 2022 (NAICS 624120) and Home Care Pulse; margins from the Addus 10-K and Home Care Pulse. The $656,073 figure at 9.9% is the one Home Care Pulse itself reported. The 15% column is the improvement scenario in that same article, not a measured median.
The honest reading: below about $1 million in revenue, a home care agency mostly pays its owner a job. Past $3 million, owner earnings in the low-to-mid six figures are realistic if margins hold.
What sole proprietors in home health report to the IRS
The IRS shows the bottom of the market. In Statistics of Income Table 1 for tax year 2023, 478,730 sole proprietor returns in home health care services reported $14.0 billion in business receipts, an average of $29,268 per return, and average net income of just $3,714 after losses. The 309,731 returns with a profit averaged $38,098 in receipts and $15,479 in net income (my division). Most of these are independent caregivers filing a Schedule C, not agencies with staff, so they show what self-employed care work pays rather than what an agency earns.
How do home care agencies make money?
They bill by the hour (or by the visit for skilled home health) and pay caregivers less per hour than they bill. The spread pays for everything else. Addus’s personal care segment gives the clearest public unit numbers for 2025:
- Average billable census of 51,249 clients, each receiving 70.1 billable hours a month.
- Revenue per billable hour of $25.48.
- That works out to roughly $21,250 of revenue per client per year ($1.089B in segment revenue divided by average census, my math).
- 201 personal care locations, or about $5.4 million of revenue per location.
Aveanna’s private duty segment shows the same mechanics at a skilled rate: $43.39 billed per hour against $30.56 in cost of revenue per hour, a spread of $12.83 (29.6%). The payer decides the rate. Aveanna’s 2025 revenue came 58.7% from Medicaid managed care plans and 22.8% from traditional Medicaid. Private-pay non-medical agencies price for the local market instead, which is where most of the margin difference comes from. Winning private-pay families is a marketing job; our home care marketing guide covers channels and agency costs.
Home care agency unit economics worksheet
Copy this into a spreadsheet and replace the example numbers with yours. The example uses the BLS median wage for home health and personal care aides ($17.21 an hour, May 2025) and the Home Care Pulse rule of thumb that your bill rate should be double your caregiver pay rate.
- Billable hours per week (A). Example: 1,000 hours, for instance about 70 clients at roughly 14 hours each.
- Average bill rate (B). Example: $34.42, which is 2 x $17.21.
- Annual revenue (C) = A x B x 52. Example: $1,789,840.
- Average caregiver pay rate (D). Example: $17.21.
- Payroll burden (E): employer payroll taxes, unemployment insurance and workers’ comp as a % of wages. Example: 12% (my assumption; get yours from your payroll provider and insurer).
- Direct cost of care (F) = A x D x 52 x (1 + E). Example: $894,920 wages + $107,390 burden = $1,002,310.
- Gross margin (G) = C minus F. Example: $787,530, or 44.0%.
- Overhead (H): office staff, rent, software, insurance, recruiting, marketing. Example: 30% of revenue, $536,952 (my assumption).
- Operating profit (I) = G minus H. Example: $250,578, or 14.0%.
| Check | Pass | Fail, and what it usually means |
|---|---|---|
| Bill rate divided by pay rate | 2.0 or higher | Below 1.7: you are pricing like a Medicaid provider without Medicaid volume |
| Gross margin (G divided by C) | 38% or higher (HCP 2020 median) | Below 30%: overtime, unbilled travel or a low payer rate is eating the spread |
| Overhead (H divided by C) | Falls as hours grow | Rising with growth: you are adding office staff faster than billable hours |
| Operating profit (I divided by C) | Near 10% (HCP $5M+ median was 9.9%) | Negative below 500 hours a week is common; check the break-even hours |
Break-even hours per week = overhead in dollars divided by (gross margin per hour x 52). In the example, gross margin per hour is $34.42 minus ($17.21 x 1.12), or $15.14, so $536,952 of overhead needs about 682 billable hours a week before the agency makes a dollar. The thresholds in the pass/fail table are my editorial rubric built from the sources above, not an industry standard. Real agencies land below the 44% example because of overtime, travel time and training hours that cannot be billed, which is why the HCP median is 38%.
What is the 80/20 rule in home care?
In home care it usually refers to the Medicaid “80/20” rule, not the Pareto principle. Under 42 CFR 441.302(k), states must ensure that each provider spends 80% of the Medicaid payments it receives for homemaker, home health aide and personal care services under 1915(c) waivers on total compensation for the direct care workers who deliver those services. States may set a different percentage for small providers they define. The current regulation text applies the requirement six years after July 9, 2024, so July 2030. Rules like this can be changed before they take effect, so check the current text before you plan around it. For a Medicaid-heavy agency, it caps what is left for overhead and profit at 20% of those payments.
What type of caregiver makes the most money?
Licensed nurses, by a wide margin. Per BLS May 2025 data:
- Registered nurses: $97,550 median a year ($46.90 an hour).
- Licensed practical and vocational nurses: $64,400 median a year; $63,580 in home healthcare services.
- Home health and personal care aides: $35,800 median a year ($17.21 an hour); $36,230 in home healthcare services and $34,900 in individual and family services.
BLS counts 4,677,100 aide jobs in 2025 and projects 18% growth to 2035. That demand is also why turnover dominates agency economics: Activated Insights’ 2025 benchmarking release reported caregiver turnover of 75%, the lowest in five years, and said agencies with at least 8 hours of onboarding and 12 hours of ongoing training reported an average annual revenue increase of nearly $350,000.
What is the typical profit margin for a home care franchise?
I found no public dataset of franchise unit net margins. A franchise unit runs on the same gross margin math as an independent agency and then pays royalties and brand fees out of it, so expect its net margin to sit at or below the 9.9% Home Care Pulse figure unless the brand lifts your bill rate or volume. If you are weighing a franchise against going independent, our piece on franchise marketing covers what the national brand does and does not do for local demand.
How these numbers were built
- Census SUSB 2022: employer firms only, with US totals from the receipts-size workbook and the detailed employment-size file. Receipts and payroll are published in $1,000; every average on this page is total receipts divided by firms. The Census API needs a key, so the downloadable files were used. SUSB applies noise for confidentiality; the smallest receipts band carries medium or high noise flags on employment.
- IRS SOI: nonfarm sole proprietorships, tax year 2023, published March 2026. Figures are sample-based estimates.
- 10-K filings: Addus fiscal year ended December 31, 2025; Aveanna fiscal year ended January 3, 2026. Margins are as reported or computed from reported dollar figures.
- Home Care Pulse: 2020 study figures, the most recent median gross margin the firm has published in a free article. Later reports are paid.
If you want help turning these benchmarks into a growth plan for your agency, you can book a consultation.
Ready to scale your revenue?
Book a free 30-min consultation. We’ll diagnose your growth bottleneck and map out the 3 highest-leverage moves for your business.
Frequently asked questions
What is the average revenue of a home care agency?
Census Bureau SUSB data for 2022 shows 34,343 non-medical home care employer firms (NAICS 624120) averaging $2,092,588 in receipts, and 28,198 home health firms (NAICS 621610) averaging $4,019,803. The averages are pulled up by a few hundred very large operators. More than half of non-medical firms took in under $500,000, and firms with fewer than 20 employees averaged $323,829.
How much do home care agency owners make?
No official survey of owner pay exists. Multiplying real revenue levels by published margins gives a guide: at the Census average for $1M to $2.49M firms ($1,583,921), a 6.7% to 9.9% net margin means about $106,000 to $157,000 of profit before any owner salary. Home Care Pulse reported $656,073 of net income for the median agency with $5M or more in revenue.
Is a home care business profitable?
It can be, but margins are thin. Addus HomeCare's personal care segment had a 27.9% gross margin in 2025, and the company's net margin was 6.7%. Home Care Pulse's 2020 study found a 38% median gross margin and 9.9% net income from operations for agencies with $5M or more in revenue. Private-pay agencies that bill about twice the caregiver wage do best.
What is the profit margin of a home care agency?
Gross margin, revenue minus caregiver wages and payroll costs, typically runs around 28% to 38% in the published data: 27.9% for Addus's personal care segment in 2025, 29.6% for Aveanna's private duty segment, and a 38% median in Home Care Pulse's 2020 study. Net margins are much lower, about 7% to 10% in the figures available.
What is the 80/20 rule in home care?
It is a Medicaid rule at 42 CFR 441.302(k). States must ensure providers spend at least 80% of Medicaid payments for homemaker, home health aide and personal care services under 1915(c) waivers on direct care worker compensation. States can set a different level for small providers. The current regulation applies it from July 2030, six years after July 9, 2024.
How do home care agencies make money?
They bill clients or payers by the hour and pay caregivers less per hour than they bill. Addus billed $25.48 per personal care hour in 2025, with clients averaging 70.1 hours a month, about $21,250 per client per year. Private-pay agencies set their own rates; a common rule of thumb is a bill rate double the caregiver pay rate.
What type of caregiver makes the most money?
Registered nurses earn the most: a $97,550 median salary in May 2025, according to BLS. Licensed practical nurses earned a $64,400 median ($63,580 in home healthcare services). Home health and personal care aides earned a $35,800 median, or $17.21 an hour, and $36,230 in home healthcare services.
Practice economics benchmarks