
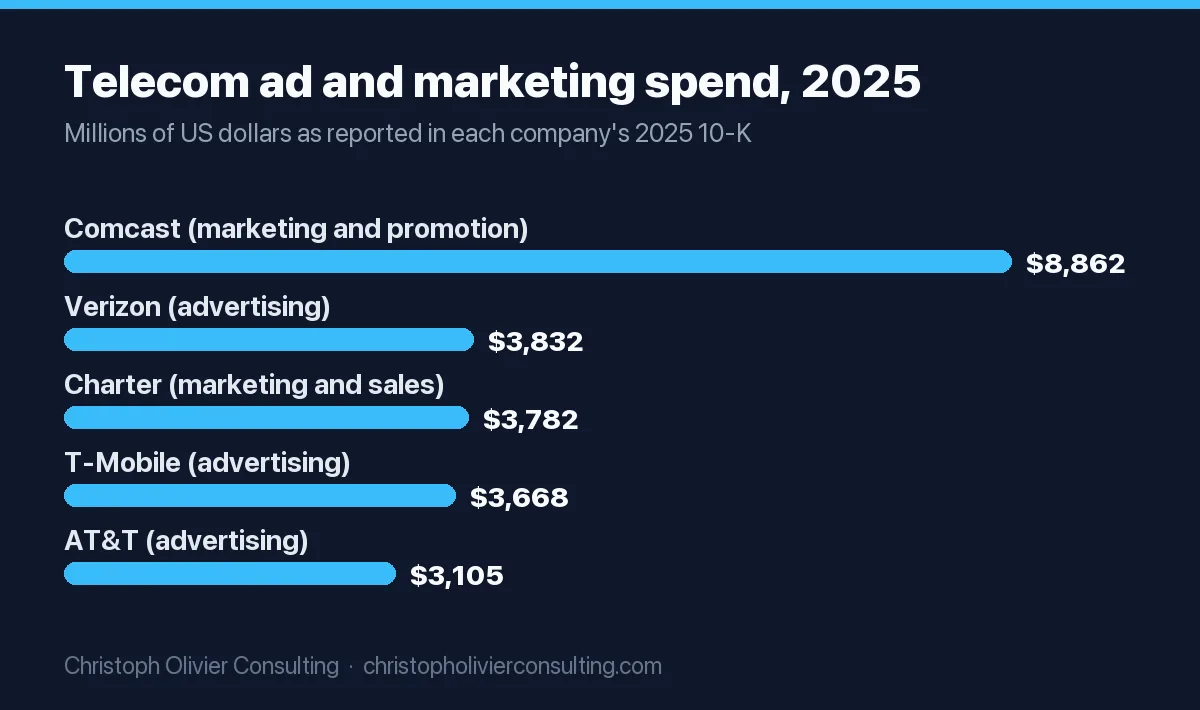
Verizon spent $3.83 billion on advertising in 2025, according to its own 10-K. AT&T spent $3.1 billion and T-Mobile $3.7 billion in the same year. Comcast reported $8.86 billion of “marketing and promotion”, and Charter (Spectrum) $3.78 billion of “marketing and residential sales”, but neither cable company breaks out pure advertising. Every figure on this page is copied from the company’s annual or quarterly filing on SEC EDGAR, with the fiscal year next to it.
Short answer: Verizon: $3,832 million of advertising expense in 2025 (2.77% of revenue), down from $3,976 million in 2024. AT&T: $3,105 million in 2025 (2.47%), up 24% after a new campaign. T-Mobile: $3.7 billion in 2025 (4.15%), the fastest grower of the three. Comcast and Charter report wider marketing lines of $8,862 million and $3,782 million. All five use calendar fiscal years.
The three wireless carriers each disclose a single advertising number. The two cable companies disclose broader cost lines that mix advertising with promotion, sales labor or film marketing. The tables keep that difference visible, so you are never comparing an apple to a fruit basket.
Telecom advertising spend compared: Verizon, AT&T, T-Mobile, Comcast, Charter (2025)
Spend and revenue in each row come from the same 10-K. The percentage column is my calculation, using one formula for every company: advertising as % of revenue = reported line ÷ total revenue × 100. Worked example, Verizon 2025: $3,832 million ÷ $138,191 million × 100 = 2.77%.
| Company | Exact line in the filing | Fiscal year | Reported amount | Revenue (same filing) | % of revenue (calculated) | Source |
|---|---|---|---|---|---|---|
| Verizon | “Advertising expense” (includes promotional and sponsorship costs), in SG&A | 2025, Dec 31, 2025 | $3,832 million | $138,191 million | 2.77% | Verizon 2025 10-K |
| AT&T | “Advertising expense” | 2025, Dec 31, 2025 | $3,105 million | $125,648 million | 2.47% | AT&T 2025 10-K |
| T-Mobile US | “Advertising expense” (advertising and other promotional expenditures), in SG&A | 2025, Dec 31, 2025 | $3.7 billion ($3,668 million in the segment table) | $88,309 million | 4.15% | T-Mobile 2025 10-K |
| Comcast | “Marketing and promotion” (income statement line, covers cable, NBCUniversal and studios) | 2025, Dec 31, 2025 | $8,862 million | $123,707 million | 7.16% | Comcast 2025 10-K |
| Charter (Spectrum) | “Marketing and residential sales” (marketing plus sales labor), inside operating costs | 2025, Dec 31, 2025 | $3,782 million | $54,774 million | 6.90% | Charter 2025 10-K |
Read the bottom two rows as upper bounds for advertising, not as advertising. Comcast’s line includes film and TV marketing at NBCUniversal, and Charter’s includes the cost of its residential sales force. The wireless carriers’ lines are the closest thing to a pure ad budget that any of these companies publishes.
How much does Verizon spend on advertising? $3.83 billion in 2025
Verizon’s 2025 10-K reports advertising expense of $3,832 million for 2025, $3,976 million for 2024 and $3,847 million for 2023. Its accounting note says “costs for advertising products and services, as well as other promotional and sponsorship costs” are charged to selling, general and administrative expense when incurred. So the figure already includes sports and event sponsorships.
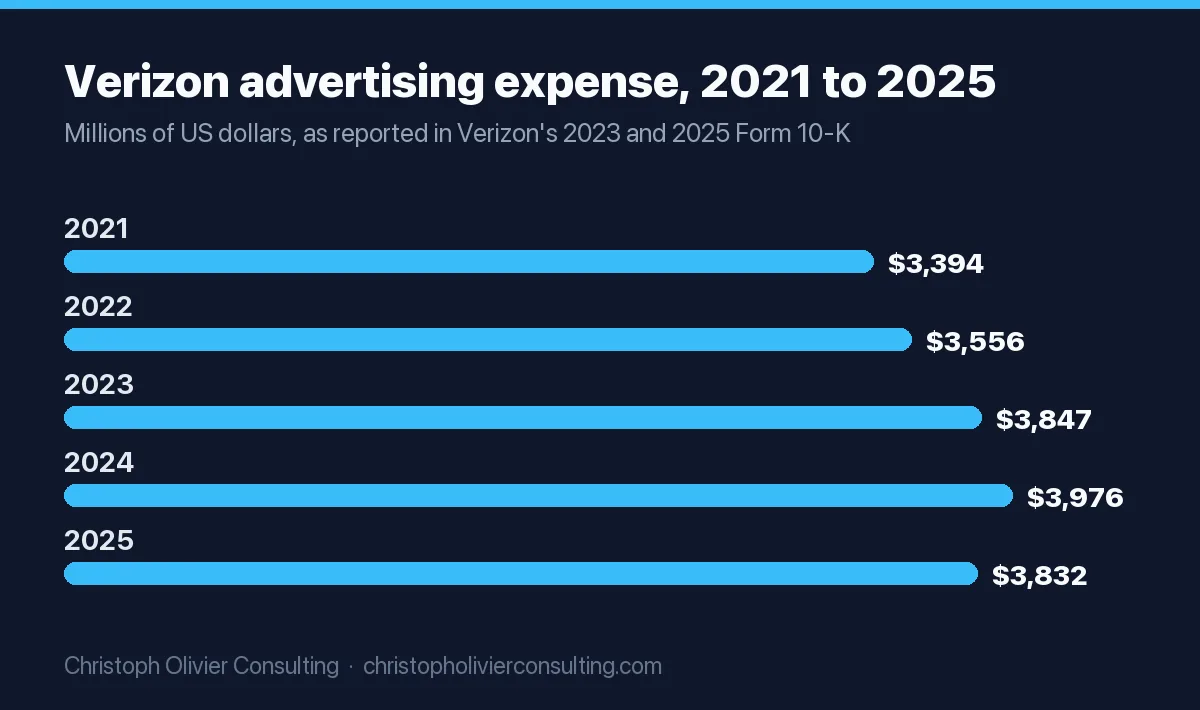
The 2025 dip was small: the filing lists “a decrease of $150 million in advertising costs” in consolidated SG&A, including $68 million in the Consumer segment and $44 million in the Business segment. Against $138,191 million of revenue, Verizon spent 2.77 cents of every revenue dollar on advertising.
Verizon advertising spend by year, 2021 to 2025
The 2021 and 2022 figures come from Verizon’s 2023 10-K; 2023 to 2025 from the 2025 10-K. That earlier filing tied the 2023 jump to “costs associated with the myPlan launch in the second quarter of 2023 and the scaling of our Total by Verizon prepaid brand”.
| Year | Advertising expense (reported) | Change vs prior year (calculated) | Operating revenues | % of revenue (calculated) |
|---|---|---|---|---|
| 2021 | $3,394 million | n/a | $133,613 million | 2.54% |
| 2022 | $3,556 million | +4.8% | $136,835 million | 2.60% |
| 2023 | $3,847 million | +8.2% | $133,974 million | 2.87% |
| 2024 | $3,976 million | +3.4% | $134,788 million | 2.95% |
| 2025 | $3,832 million | −3.6% | $138,191 million | 2.77% |
Verizon in 2026: advertising down $676 million through September
Verizon does not publish a quarterly advertising total, but its third-quarter 2026 10-Q explains the change. For the first nine months of 2026, consolidated SG&A included “a decrease of $676 million in advertising costs related to various marketing campaigns in 2025 that did not reoccur”, with $201 million of that in the third quarter alone. If nothing else moved, that points to a full-year 2026 figure below 2025’s $3,832 million. The exact number arrives with the 2026 10-K in early 2027.
How much does Verizon spend on commercials?
Not disclosed. Verizon reports one advertising figure that covers every medium plus promotions and sponsorships, with no split for TV commercials, digital or individual campaigns. Any per-commercial or per-medium number you see comes from ad-tracking firms that estimate measured media; those estimates cover only a slice of the $3,832 million total.
AT&T advertising budget: $3.1 billion in 2025
AT&T’s 2025 10-K reports advertising expense of $3,105 million in 2025, $2,505 million in 2024 and $2,576 million in 2023. That is a 24% jump in one year (my calculation). The filing explains why: costs in the Communications segment rose on “higher network-related expenses and advertising costs due to the launch of a new campaign in 2025”. Against $125,648 million of operating revenues, the 2025 budget is 2.47% of revenue.
The increase has continued. AT&T’s third-quarter 2026 10-Q cites “higher advertising expenses” in both the quarter and the first nine months of 2026, without giving the dollar amount.
Why AT&T’s ad budget looked like $6 billion before 2022
Older articles quote AT&T ad budgets above $5 billion. Those years included WarnerMedia (HBO, CNN, Warner Bros.), which AT&T spun off in 2022. AT&T’s 2023 10-K restates 2021 to $2,732 million on the current business. Use that restated figure for any trend, not the old consolidated number.
| Year | AT&T advertising expense (reported) | Operating revenues | % of revenue (calculated) | Filing |
|---|---|---|---|---|
| 2021 (restated, without WarnerMedia) | $2,732 million | $134,038 million | 2.04% | 2023 10-K |
| 2022 | $2,462 million | $120,741 million | 2.04% | 2023 10-K |
| 2023 | $2,576 million | $122,428 million | 2.10% | 2025 10-K |
| 2024 | $2,505 million | $122,336 million | 2.05% | 2025 10-K |
| 2025 | $3,105 million | $125,648 million | 2.47% | 2025 10-K |
How much does T-Mobile spend on advertising? $3.7 billion in 2025
T-Mobile’s 2025 10-K says advertising expenses in SG&A “were $3.7 billion, $3.1 billion and $2.5 billion” for 2025, 2024 and 2023. Its segment table gives the unrounded figures: $3,668 million, $3,067 million and $2,515 million. The 2023 10-K adds $2.3 billion for 2022 and $2.2 billion for 2021.
T-Mobile is the only one of the three carriers whose ad budget grew every year in this period. It went from 3.20% of revenue in 2023 to 4.15% in 2025 (my calculation), while total revenues grew from $78,558 million to $88,309 million. The 2025 filing lists “higher advertising expenses” among the drivers of a $2.7 billion rise in SG&A.
T-Mobile is also the only one that publishes a quarterly ad figure. Its third-quarter 2026 10-Q shows $2,783 million for the first nine months of 2026, against $2,582 million a year earlier, with $956 million in the third quarter.
Comcast advertising spend: $8.86 billion of marketing and promotion in 2025
Comcast’s 2025 10-K reports “marketing and promotion” of $8,862 million in 2025, $8,073 million in 2024 and $7,971 million in 2023. Its accounting note says only that “advertising costs are expensed as incurred”; it gives no separate advertising total.
The line is broader than Xfinity ads. The segment tables put $1,463 million of it in Media (NBC, Peacock, cable networks) and $1,773 million in Studios (film and TV marketing), so $3,236 million, or 36.5%, sits outside the connectivity business (my calculation). The same filing says amortization of contract acquisition and fulfillment costs ($733 million in 2025) is “included in marketing and promotion and other operating and administrative expenses”, without saying how much lands in each.
Comcast also sells advertising. Its Media segment booked $8,382 million of domestic advertising revenue in 2025, nearly as much as the whole group spent on marketing and promotion. Through September 2026, the third-quarter 2026 10-Q shows marketing and promotion of $6,540 million, against $6,435 million a year earlier. Earlier years from the 2023 10-K: $8,506 million in 2022 and $7,695 million in 2021.
Charter (Spectrum) marketing budget: $3.78 billion in 2025, ads not broken out
Charter’s 2025 10-K shows “marketing and residential sales” of $3,782 million in 2025, $3,590 million in 2024 and $3,469 million in 2023. The filing defines the line as “the costs of marketing residential and business Internet, mobile, video and voice services and costs to sell to current and potential non-bulk residential customers, including labor cost”. So it is a marketing-plus-sales budget. Charter says only that advertising costs “are generally expensed as costs are incurred”.
The 2025 rise of $192 million was “primarily due to a change in sales mix to higher cost sales channels”, not more media. One trap: Charter’s 2023 10-K used a differently defined “sales and marketing” line ($3,653 million for 2023), so do not mix the two series.
Telecom advertising trend, 2021 to 2025
All figures in millions of US dollars, as reported. T-Mobile’s 2021 and 2022 values are rounded to $0.1 billion in its filing. Charter’s comparable series starts in 2023.
| Company (line) | 2021 | 2022 | 2023 | 2024 | 2025 |
|---|---|---|---|---|---|
| Verizon (advertising expense) | 3,394 | 3,556 | 3,847 | 3,976 | 3,832 |
| AT&T (advertising expense, 2021 restated) | 2,732 | 2,462 | 2,576 | 2,505 | 3,105 |
| T-Mobile (advertising expense) | 2,200 | 2,300 | 2,515 | 3,067 | 3,668 |
| Comcast (marketing and promotion) | 7,695 | 8,506 | 7,971 | 8,073 | 8,862 |
| Charter (marketing and residential sales) | n/a | n/a | 3,469 | 3,590 | 3,782 |
Three patterns stand out. T-Mobile grew its ad budget 67% from 2021 to 2025 (my calculation). Verizon was flat to slightly down after 2024 and is cutting in 2026. AT&T held near $2.5 billion for four years, then jumped in 2025.
Why the advertising line is not the whole customer-acquisition bill
If you are trying to answer “what does it cost a carrier to win a customer”, the advertising line understates it. Three bigger costs sit elsewhere in the filings.
- Device promotions. Verizon’s 10-K says “aggressive device promotions and price lock guarantees have become more common in recent years in an effort to encourage customers to switch carriers”. These are priced into the customer contract rather than booked as advertising. T-Mobile’s 2025 10-K describes contract assets that “primarily represent revenue recognized for equipment sales with promotional bill credits offered to customers that are paid over time”; that balance rose from $720 million to $1,307 million during 2025.
- Sales commissions. Verizon’s 2025 filing cites “an increase in sales commission expense due to higher volumes” in SG&A, separate from advertising. Comcast amortizes contract acquisition costs partly through its marketing line, and Charter folds sales labor into its own.
- Cost of equipment. T-Mobile’s segment table shows $21,277 million of equipment cost in 2025, almost six times its advertising expense. Phones sold below cost, or paid back through monthly credits, are part of how carriers compete.
So the 2.5% to 4% advertising ratios are the media and sponsorship slice only. Promotions and selling costs are a separate, larger pile that the filings do not total in one place.
Which company has the highest marketing budget?
Among the five telecom and cable groups here, Comcast, with $8,862 million of marketing and promotion in 2025. Among the three wireless carriers, Verizon, with $3,832 million of advertising. Across all US filers, Amazon’s 2025 10-K reports “advertising and other promotional costs” of $23.5 billion, more than six times Verizon’s figure. Our big brand marketing budgets page compares consumer brands such as Nike and Coca-Cola, and retail advertising spend covers Walmart, Target and Home Depot from the same kind of filings.
What a regional ISP, wireless dealer or local business can borrow from these numbers
National carriers are not a budget template for a 40-person fiber ISP or a phone repair chain. They have brand awareness you do not, and their promotions budget dwarfs their ad budget. What the filings do give you is a set of real, audited ratios to sanity-check your own plan. Wider benchmarks by sector are in our advertising-to-sales ratio by industry guide.
Decision table: which telecom ratio fits your situation
This table is my judgment applied to the reported ratios above. It is a starting point, not a rule.
| Your situation | Closest reference | Ratio (2025, calculated) | Why it fits |
|---|---|---|---|
| Established provider defending a stable base, little new territory | Verizon, AT&T | 2.47% to 2.77% | Both hold big existing bases and spend mostly to retain and upsell |
| Challenger taking share, launching in new areas | T-Mobile | 4.15% | The one carrier raising its ratio every year while revenue grew 12.4% from 2023 to 2025 |
| Budget must also pay your salespeople | Charter | 6.90% | Charter’s line is marketing plus residential sales labor |
| Budget covers everything: people, agencies, tech, media | Gartner survey average | 7.7% of revenue | Total marketing budgets, not just advertising (see below) |
Worked example: a $20 million regional ISP
Plug in your own revenue. The example is hypothetical.
| Benchmark | Formula | Annual budget | Per month |
|---|---|---|---|
| AT&T ratio, advertising only | $20,000,000 × 2.47% | $494,000 | $41,167 |
| Verizon ratio, advertising only | $20,000,000 × 2.77% | $554,000 | $46,167 |
| T-Mobile ratio, advertising only | $20,000,000 × 4.15% | $830,000 | $69,167 |
| Charter ratio, marketing plus sales | $20,000,000 × 6.90% | $1,380,000 | $115,000 |
| Gartner average, total marketing | $20,000,000 × 7.7% | $1,540,000 | $128,333 |
Pass/fail check before you commit: divide the chosen budget by your expected new customers to get a cost per acquisition, then compare it with the gross profit one customer brings in over a year. If the cost per acquisition is higher, start at the lower ratio and prove the channel first. Our guide to how to set a marketing budget walks through the full model, and you can book a consultation if you want a second pair of eyes on the numbers.
What is a typical marketing budget?
Gartner’s 2025 CMO Spend Survey, as reported by Campaign Asia, found “average marketing budgets are at 7.7% of company revenue for a second consecutive year”, and “half of CMOs reported budgets of 6% or less”. That covers the whole marketing budget, so it is not comparable to the carriers’ advertising-only lines. For more survey data, see our CMO marketing budget statistics.
What is the 70/20/10 rule for marketing budget?
It comes from Coca-Cola’s Content 2020 strategy, summarized by TopRank Marketing as “70% is safe content, 20% is innovating on what works well, and 10% is high-risk.” Applied to a budget: 70% to channels with proven returns, 20% to improving them, 10% to tests. It is a rule of thumb, not a measured optimum.
What is the 40-40-20 rule in marketing?
A direct-marketing rule of thumb. As Chief Marketer put it in 2006, “40% of the success of a campaign is due to lists, 40% to the offer, and 20% to the creative.” For a telecom, the “offer” half is exactly the device and price promotions that never show up in the advertising line.
How to check any telecom’s ad spend on EDGAR
- Open SEC EDGAR, search the company name and filter to form 10-K (all five companies here file in late January or February).
- Search the document for “advertising expense”, “advertising costs” or “marketing and promotion”.
- Check where the number lives: Verizon and AT&T put it in a supplementary income statement table, T-Mobile in its accounting policies note and segment table, Comcast and Charter in their cost tables.
- Read the definition: does it include sponsorships, sales labor or film marketing?
- Take total revenue from the same filing and divide. For in-year updates, read the “Selling, general and administrative” explanation in each 10-Q.
Ready to scale your revenue?
Book a free 30-min consultation. We’ll diagnose your growth bottleneck and map out the 3 highest-leverage moves for your business.
Frequently asked questions
How much does Verizon spend on advertising?
Verizon's 2025 10-K reports advertising expense of $3,832 million for 2025, down from $3,976 million in 2024 and up from $3,847 million in 2023. The figure includes promotional and sponsorship costs and sits in selling, general and administrative expense. On $138,191 million of revenue, that is about 2.77%. Its Q3 2026 10-Q shows advertising costs down $676 million in the first nine months of 2026.
How much did Verizon spend on advertising in 2025?
$3,832 million, according to the supplementary income statement table in Verizon's 2025 Form 10-K, filed with the SEC in February 2026. That was 3.6% less than 2024's $3,976 million. The filing attributes the change partly to a $150 million decrease in advertising costs in consolidated selling, general and administrative expense. Verizon does not split the total by TV, digital or sponsorship.
What is AT&T's advertising budget?
AT&T reported advertising expense of $3,105 million in 2025, up from $2,505 million in 2024 and $2,576 million in 2023, according to its 2025 10-K. The company tied the increase to the launch of a new campaign in 2025. That is about 2.47% of its $125,648 million in operating revenues. Pre-2022 figures above $5 billion included WarnerMedia, which AT&T spun off.
How much does T-Mobile spend on advertising?
T-Mobile's 2025 10-K reports advertising expenses of $3.7 billion in 2025, $3.1 billion in 2024 and $2.5 billion in 2023, all within selling, general and administrative expense. The segment table gives $3,668 million for 2025, about 4.15% of $88,309 million in revenue. Its Q3 2026 10-Q shows $2,783 million for the first nine months of 2026, up from $2,582 million.
What is Comcast's advertising spend?
Comcast does not disclose a separate advertising figure. Its 2025 10-K reports marketing and promotion of $8,862 million, up from $8,073 million in 2024. That line covers Xfinity, NBCUniversal media and film marketing: $1,463 million sat in Media and $1,773 million in Studios. It equals about 7.16% of Comcast's $123,707 million revenue.
Which telecom company spends the most on advertising?
Among the three national wireless carriers, Verizon spent the most in 2025, with $3,832 million of advertising expense, ahead of T-Mobile at $3.7 billion and AT&T at $3,105 million. Comcast's broader marketing and promotion line was larger, at $8,862 million, but it includes film, TV network and promotion costs, so it is not a pure advertising figure.
What big companies spend on marketing