

The biggest US card and bank brands each spent between $1 billion and $6.3 billion on marketing in 2025, according to their own 10-K filings. American Express reported $6,252 million, Capital One $5,884 million, JPMorgan Chase $5,531 million, Bank of America $2,204 million, Wells Fargo $1,094 million and Citigroup $1,097 million. Community banks spend far less in dollars and as a share of assets: the ABA’s bank marketer survey puts the typical budget at 0.05% to 0.07% of assets.
Short answer: American Express: $6.25 billion (2025, 8.7% of revenue). Capital One: $5.9 billion (11.0%). Chase: $5.5 billion (3.0%). Bank of America: $2.2 billion (1.9%). Wells Fargo and Citi: about $1.1 billion each (1.3%). Card-heavy lenders spend 3 to 9 times more per revenue dollar than deposit-led banks, and 2026 is running higher: Chase spent $5.19 billion in the first nine months alone.
Every company figure below comes from the company’s own annual or quarterly report on SEC EDGAR, read in November 2026. Each row keeps the filing’s own line-item name, because “marketing” at a bank can include partner payments, direct mail and brand advertising, and each bank draws the line differently. Percentages are my calculations from numbers in the same filing.
How much do banks spend on marketing? The 2025 10-K numbers
Three ratios, one formula each, all from the same 10-K: % of revenue = marketing ÷ total net revenue × 100; % of noninterest expense = marketing ÷ total noninterest expense × 100; % of assets = marketing ÷ year-end total assets × 100. Worked example, Capital One 2025: $5,884 million ÷ $53,434 million × 100 = 11.0% of revenue.
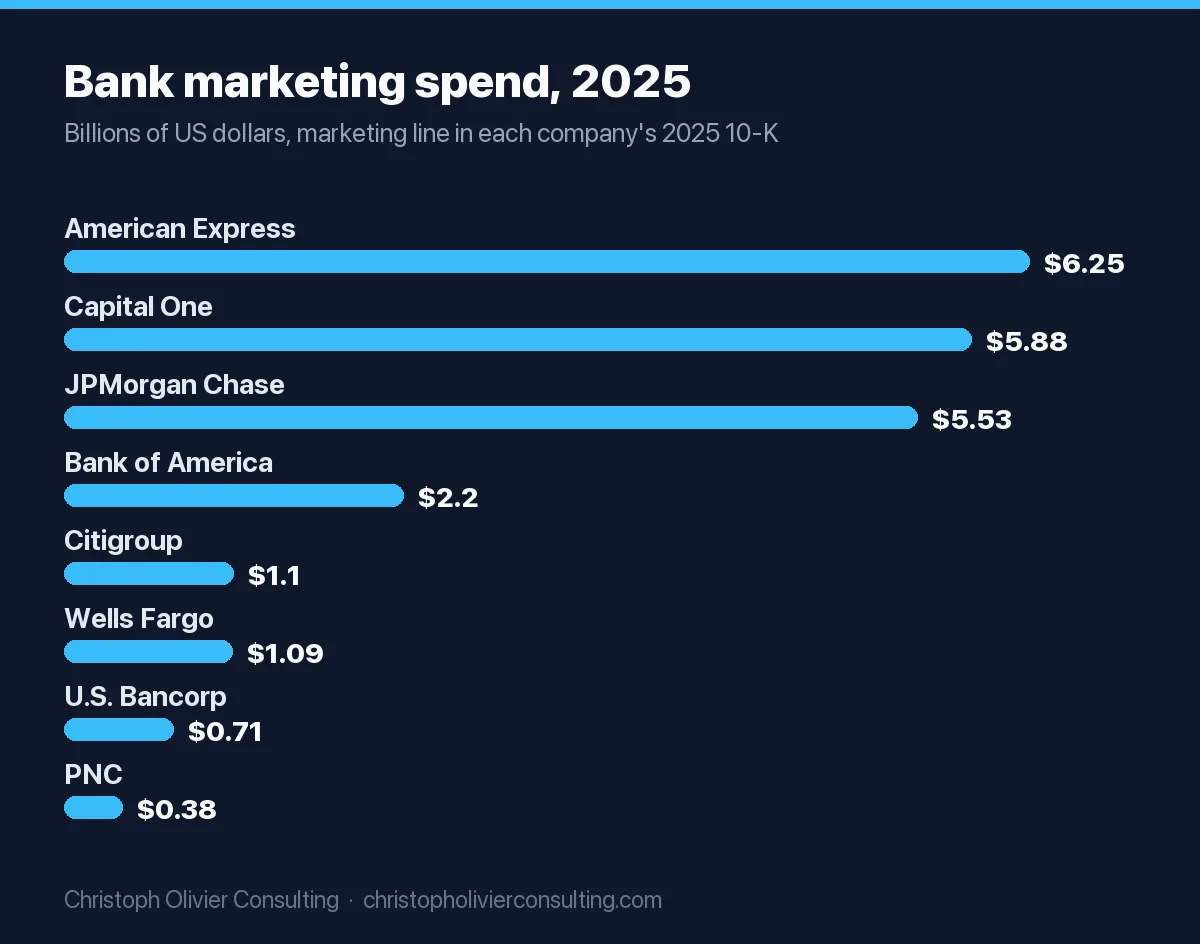
| Company | Exact line item | 2025 marketing (reported) | Total net revenue | % of revenue | % of noninterest expense | % of total assets | Source |
|---|---|---|---|---|---|---|---|
| American Express | “Marketing” | $6,252M | $72,229M | 8.7% | 11.8% | 2.08% | AmEx 10-K, 2025 |
| Capital One | “Marketing” | $5,884M | $53,434M | 11.0% | 19.3% | 0.88% | Capital One 10-K, 2025 |
| JPMorgan Chase | “Marketing” | $5,531M | $182,447M | 3.0% | 5.8% | 0.125% | JPMorgan Chase 10-K, 2025 |
| Bank of America | “Marketing” | $2,204M | $113,097M | 1.9% | 3.2% | 0.065% | Bank of America 10-K, 2025 |
| Citigroup | “Advertising and marketing” | $1,097M | $85,225M | 1.3% | 2.0% | 0.041% | Citigroup 10-K, 2025 |
| Wells Fargo | “Advertising and promotion” | $1,094M | $83,699M | 1.3% | 2.0% | 0.051% | Wells Fargo 2025 Annual Report (10-K exhibit) |
| U.S. Bancorp | “Marketing and business development” | $705M | $28,656M | 2.5% | 4.2% | 0.102% | U.S. Bancorp 2025 Annual Report (10-K exhibit) |
| Synchrony | “Marketing and business development” | $511M | n/a (see note) | n/a | 10.0% | 0.43% | Synchrony 10-K, 2025 |
| PNC | “Marketing” | $378M | $23,099M | 1.6% | 2.7% | 0.066% | PNC 10-K, 2025 |
| Truist | “Marketing and customer development” | $299M | $20,319M | 1.5% | 2.5% | 0.055% | Truist 10-K, 2025 |
| Ally Financial | “Advertising and marketing” (note 7) | $259M | $7,914M | 3.3% | 4.8% | 0.132% | Ally 10-K, 2025 |
Notes: total assets are the December 31, 2025 balance-sheet figure each company tagged in its 10-K XBRL data on SEC’s company facts API. Synchrony reports no single “total net revenue” line comparable to the others (its income statement nets retailer share arrangements separately), so I left that ratio blank rather than build one. Revenue for Citi is “revenues, net of interest expense”; for American Express, “total revenues net of interest expense”.
The split is clear. Card-centric issuers (American Express, Capital One, Synchrony) spend 8% to 20% of their operating costs on marketing, because they acquire customers one application at a time through direct mail, digital ads and partner channels. Branch-based universal banks spend 2% to 6%. If you want to compare against non-bank advertisers, the same method is used in our breakdown of big brand marketing budgets and our retail advertising spend comparison.
Bank marketing spend is rising faster in 2026
The third-quarter 10-Qs, filed between October 23 and November 5, 2026, show nine-month marketing spend up at every big name except Citi. Chase has already spent 94% of its full-2025 total by September 30 (my calculation: $5,191M ÷ $5,531M).
| Company | 2023 | 2024 | 2025 | First 9 months 2025 | First 9 months 2026 | 9-month change | 2026 source |
|---|---|---|---|---|---|---|---|
| American Express | $5,213M | $6,040M | $6,252M | $4,640M | $4,900M | +6% | 10-Q, Q3 2026 |
| Capital One | $4,009M | $4,562M | $5,884M | $3,950M | $4,752M | +20% | 10-Q, Q3 2026 |
| JPMorgan Chase | $4,591M | $4,974M | $5,531M | $4,063M | $5,191M | +28% | 10-Q, Q3 2026 |
| Bank of America | $1,927M | $1,956M | $2,204M | $1,641M | $1,938M | +18% | 10-Q, Q3 2026 |
| Wells Fargo | $812M | $869M | $1,094M | $742M | $1,067M | +44% | 10-Q, Q3 2026 |
| Citigroup | $1,393M | $1,113M | $1,097M | $779M | $750M | −4% | 10-Q, Q3 2026 |
2023 to 2025 values come from the three-year income statements in each company’s 2025 10-K (linked in the first table). The percentage change is my calculation. Capital One’s 2026 comparison is flattered by Discover: the 2025 nine months include Discover only from the May 18, 2025 closing date.
American Express marketing budget: $6.25 billion (2025)
American Express reported marketing expense of $6,252 million for 2025, up 4% from $6,040 million in 2024 and $5,213 million in 2023, per its 2025 10-K. That is the largest marketing line of any US bank holding company in this comparison, and 8.7% of its $72,229 million in revenue. The 10-K says marketing rose “as we continued to invest to acquire high-spending, high credit-quality customers” and, in the expense discussion, “primarily due to higher levels of spending on customer acquisition and brand advertising.”
The marketing line is only one of four customer-facing costs AmEx reports separately. In 2025 it also booked Card Member rewards of $18,409 million, business development (mainly partner payments and client incentives) of $6,457 million and Card Member services of $6,057 million. None of those are in the $6.25 billion. Through September 2026 marketing was $4,900 million, up 6% year on year, per the Q3 2026 10-Q.
How much does American Express spend on advertising?
American Express does not break advertising out as its own number. Brand advertising sits inside the $6,252 million marketing line alongside customer acquisition spending, and the 10-K says “global brand advertising is primarily allocated to the segments based on the relative levels of revenue.” So the honest answer is: advertising is some part of $6.25 billion, and the company does not say how much.
Capital One marketing budget: $5.9 billion (2025)
Capital One reported marketing expense of $5,884 million in 2025, up 29% from $4,562 million in 2024 and $4,009 million in 2023, per its 2025 10-K. Of that, the Credit Card segment accounted for $5.0 billion. At 11.0% of revenue and 19.3% of all noninterest expense, Capital One is the most marketing-intensive large bank in the table.
Part of the jump is the Discover acquisition, which closed on May 18, 2025, so Discover’s spending is in the 2025 figure for about seven and a half months. The 10-K also cites “higher marketing spend” as a driver of expense growth in its segment results. For 2026, the Q3 10-Q shows $1,594 million in the third quarter alone (up 14%) and $4,752 million for nine months.
For context, Discover’s last standalone 10-K for 2024 reported marketing and business development of $1,070 million, of which advertising costs were $329 million.
Chase marketing budget: $5.5 billion (JPMorgan Chase, 2025)
JPMorgan Chase reported marketing expense of $5,531 million in 2025, up from $4,974 million in 2024 and $4,591 million in 2023, per its 2025 10-K. The firm does not publish a separate figure for the Chase consumer brand, but the 10-K attributes part of the expense growth to “higher investments … in marketing in CCB” (Consumer & Community Banking, the Chase business). Against $182,447 million of revenue, marketing is 3.0%.
One accounting detail matters if you compare Chase with AmEx: payments to co-brand card partners “based on marketing efforts undertaken by the partners” are reported as marketing expense, while partner loyalty rewards reduce card income instead. 2026 is the steepest climb in the group: $5,191 million in the first nine months, up 28%, per the Q3 2026 10-Q.
Searchers for “Chase marketing budget” also find Chase Media Solutions. That is the opposite flow of money: an ad business, launched April 3, 2024, that lets other brands reach Chase’s 80 million customers with offers. It is not part of the $5.5 billion.
Bank of America marketing budget: $2.2 billion (2025)
Bank of America reported marketing expense of $2,204 million in 2025, up from $1,956 million in 2024 and $1,927 million in 2023, per its 2025 10-K. That is 1.9% of revenue and 0.065% of its $3.41 trillion in assets, the same 0.065% that the median community bank spends in the CPG study cited below. Through September 2026 it spent $1,938 million, up 18%, per the Q3 2026 10-Q.
Wells Fargo and Citi: about $1.1 billion each (2025)
Wells Fargo reported “advertising and promotion” of $1,094 million in 2025, up 26% from $869 million, which its 2025 Annual Report attributes to “higher marketing campaign volume.” It is the fastest grower in 2026: $1,067 million through September, up 44%.
Citigroup reported “advertising and marketing” of $1,097 million in 2025, down from $1,393 million in 2023, per its 2025 10-K, and $750 million in the first nine months of 2026, the only decline among the big six.
Regional banks and card issuers: U.S. Bancorp, PNC, Truist, Synchrony, Ally
Below the top six, the 2025 figures drop to the hundreds of millions. U.S. Bancorp spent $705 million on marketing and business development, Synchrony $511 million, PNC $378 million, Truist $299 million on marketing and customer development, and online-only Ally $259 million on advertising and marketing (sources in the first table). Regional banks cluster at 0.055% to 0.10% of assets. Synchrony, a store-card issuer, runs at 0.43% of assets; its 10-K describes marketing delivered largely through partner channels such as in-store signage, retailer websites and partner advertising materials.
How much do community banks and credit unions spend on marketing?
Three primary-sourced benchmarks exist, and they agree more than you might expect.
- ABA survey, banks: “between 0.05% and 0.07% of assets,” stable for three years, with 2025 results slightly above that range (ABA Banking Journal, October 2025, 88 respondents). The 2026 edition (121 respondents, under $150 million to over $10 billion in assets) found medians rose in seven of eight asset tiers; the under-$150 million tier fell from $47,500 to $33,000.
- FDIC call report data, $2 billion to $10 billion banks: Capital Performance Group’s analysis, published by The Financial Brand in September 2023, found a 2022 median of 0.065% of average assets and 2.80% of noninterest expense. The top-spending quartile ran 0.086% of assets; the bottom quartile 0.052%.
- NCUA call report data, credit unions: my own tabulation below.
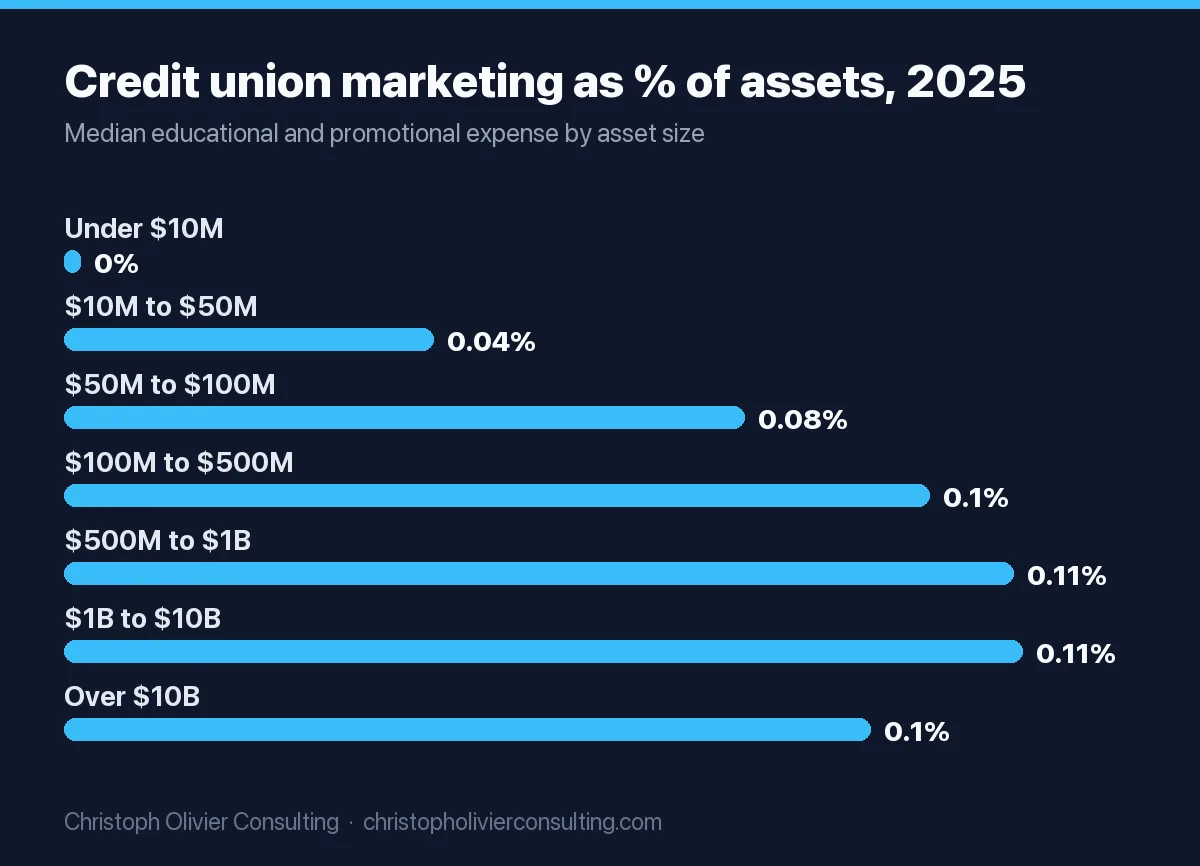
For credit unions, the NCUA 5300 call report has a mandatory line, account 270, “Educational and Promotional Expense,” defined as “advertising, publicity, and promotions.” I summed it for all 4,374 credit unions in the December 2025 call report file: $2.89 billion in 2025, which is 0.118% of $2.46 trillion in assets and 3.9% of $74.7 billion in non-interest expense. (NCUA’s own Q4 2025 data summary shows $2.43 trillion for federally insured credit unions; the bulk file includes a slightly wider set of filers.)
| Credit union asset size | Number | Median spend (2025) | Median % of assets | Aggregate % of non-interest expense | Reporting $0 |
|---|---|---|---|---|---|
| Under $10M | 809 | $101 | 0.002% | 0.9% | 372 |
| $10M to $50M | 1,163 | $10,787 | 0.044% | 2.2% | 94 |
| $50M to $100M | 584 | $57,764 | 0.081% | 2.7% | 3 |
| $100M to $500M | 1,069 | $214,595 | 0.103% | 3.2% | 1 |
| $500M to $1B | 282 | $779,685 | 0.113% | 3.4% | 0 |
| $1B to $10B | 446 | $2,401,194 | 0.114% | 4.3% | 1 |
| Over $10B | 21 | $15,837,742 | 0.096% | 3.7% | 0 |
Source: my calculation from NCUA 5300 call report data, December 31, 2025 cycle (accounts 270, 010 and 671). Spend is full-year 2025. Our credit union marketing guide covers how to spend that budget under NCUA advertising rules.
The pattern: once a credit union passes $100 million in assets, it spends roughly 0.10% to 0.11% of assets on promotion, which is roughly 1.5 to 2 times the ABA community bank range. Part of that gap is definitional (NCUA’s line is mandatory and every filer reports it; most bank figures come from surveys).
Why there is no clean FDIC total for banks
Banks do report “advertising and marketing expenses” on the call report, as Schedule RI-E item 2.b. But per the FFIEC 051 instructions, a bank itemizes a component of other noninterest expense only when it is “greater than $100,000 and exceeds 7 percent” of other noninterest expense. Banks below that bar never report the number. That is why the CPG study could only use the 52% of its sample that crossed the threshold, and why any “total US bank marketing spend” figure you see is an estimate.
What percentage of a bank’s budget should go to marketing?
No regulator sets one. The sourced ranges above give you a defensible starting band. Use this decision table, then the worked calculation below it.
| Your institution | Starting band (% of assets) | Cross-check (% of noninterest expense) | Move toward the top of the band if | Basis |
|---|---|---|---|---|
| Community bank, under $2B | 0.05% to 0.07% | 2.2% to 2.8% | you are entering a new market or need core deposits fast | ABA survey (assets); CPG bottom quartile to median (expense) |
| Bank, $2B to $10B | 0.052% to 0.086% | 2.2% to 4.1% | few branches relative to footprint | CPG quartiles, FDIC data 2022 |
| Credit union, $100M to $10B | 0.10% to 0.11% (median) | 3.2% to 4.3% | membership is aging or field of membership just widened | NCUA 2025 call reports |
| Regional or money-center bank | 0.055% to 0.13% | 2.5% to 5.8% | national digital deposit or card push | 2025 10-Ks (PNC, Truist, USB, JPM) |
| Card-led lender or issuer | 0.4% to 2.1% | 10% to 19% | acquisition is application-by-application | 2025 10-Ks (Synchrony, Capital One, AmEx) |
Copy-ready formula: Marketing budget = total assets × target % of assets. Cross-check: budget ÷ projected noninterest expense should land inside the cross-check column.
Worked example (my calculation): a $1.5 billion community bank using the ABA range budgets $1.5B × 0.05% = $750,000 to $1.5B × 0.07% = $1,050,000. At the CPG median of 0.065%, it is $975,000. If that bank’s noninterest expense is $40 million, $975,000 is 2.4%, inside the 2.2% to 2.8% band. A $1.5 billion credit union at the NCUA median for its tier (0.114%) would budget about $1.71 million.
The CPG data also carries a warning: the top-spending quartile did not grow revenue fastest (9.74% versus 10.97% for the middle half), and the study shows correlation, not cause. More money helps only if it goes to the right objective, which is the subject of our guide on how to set a marketing budget. For cross-industry percentages, see our comparison of Gartner, Forrester and CMO Survey benchmarks.
How banks use their marketing money
The 2026 ABA survey asked banks to split budgets by objective. The answer is mostly acquisition and balance growth, with less than a third going to existing customers:
| Objective | Average share of 2026 budget |
|---|---|
| Deposit growth | 30% |
| New customer acquisition | 23% |
| Loan growth | 20% |
| Deepening existing relationships | 14% |
| Retaining existing customers | 12% |
Source: ABA Banking Journal, September 22, 2026 (components rounded). On channels, 85.0% of respondents plan to increase digital advertising and 55.8% search; digital advertising scored highest on perceived return (3.78 of 5), and directories (1.52) and statement enclosures (1.63) scored lowest. The 2025 edition found outside agencies took 12% of budgets. At the top end, the 10-Ks describe the same priorities in their own words: AmEx and Capital One point to card customer acquisition, Chase to its consumer bank, Wells Fargo to campaign volume. If you are a fintech competing with these budgets, our fintech marketing guide covers where smaller budgets still win.
What is the 70/20/10 rule for marketing budget?
It splits spend into 70% proven programs, 20% extensions of what already works and 10% new experiments. Coca-Cola adapted it for content investment, as described by Millward Brown’s John Svendsen in The Media Leader (2012). For a bank, a practical reading is 70% on channels with measured deposit or loan results, 20% on scaling what tested well last year, and 10% on tests. It is a planning heuristic, not a bank benchmark.
How to check any bank’s marketing spend yourself
- Public bank holding company: open its latest 10-K on SEC EDGAR and search the document for “Marketing”, “Advertising and marketing”, “Advertising and promotion” or “business development”. The figure sits in the noninterest expense table.
- Check what the line includes. Some banks bundle business development (U.S. Bancorp, Synchrony); AmEx keeps it separate.
- Divide by total net revenue, total noninterest expense and year-end total assets from the same filing.
- Private bank: look at its call report, Schedule RI-E item 2.b. A blank means it fell under the $100,000 and 7% threshold, not that it spent nothing.
- Credit union: account 270 in the NCUA 5300 call report data, which every credit union reports.
If you are setting a marketing budget for a financial firm and want a second opinion on the number and the split, you can book a consultation. In my view the ratio matters less than knowing what each dollar is expected to produce in deposits or loans.
Ready to scale your revenue?
Book a free 30-min consultation. We’ll diagnose your growth bottleneck and map out the 3 highest-leverage moves for your business.
Frequently asked questions
What is Capital One's marketing budget?
Capital One reported marketing expense of $5,884 million in 2025, up from $4,562 million in 2024, per its 10-K. That is 11.0% of its $53,434 million in revenue, and $5.0 billion of it sat in the Credit Card segment. The 2025 figure includes Discover from May 18, 2025. Through September 2026 it spent $4,752 million.
What is Chase's marketing budget?
JPMorgan Chase reported marketing expense of $5,531 million in 2025, up from $4,974 million in 2024, per its 10-K. The firm does not split out the Chase consumer brand, but says marketing investment was concentrated in Consumer and Community Banking. In the first nine months of 2026 it spent $5,191 million, up 28%.
What is Bank of America's marketing budget?
Bank of America reported marketing expense of $2,204 million in 2025, up from $1,956 million in 2024, per its 10-K. That is 1.9% of its $113,097 million in revenue and about 0.065% of its total assets. In the first nine months of 2026 it spent $1,938 million, 18% more than a year earlier.
How much does American Express spend on advertising?
American Express does not report advertising separately. Its 2025 10-K shows marketing expense of $6,252 million, which covers both customer acquisition and brand advertising. Card Member rewards ($18,409 million), business development ($6,457 million) and Card Member services ($6,057 million) are separate lines and not included in that marketing figure.
Which bank has the biggest marketing budget?
Among US bank holding companies, American Express reported the largest 2025 marketing line at $6,252 million, followed by Capital One at $5,884 million and JPMorgan Chase at $5,531 million, per their 10-Ks. In 2026 Chase is growing fastest of the three: $5,191 million in nine months versus $4,900 million at American Express.
How much should a community bank spend on marketing?
The ABA's bank marketer survey puts typical budgets at 0.05% to 0.07% of assets, and a Capital Performance Group study of FDIC data found a 0.065% median for $2 billion to $10 billion banks. For a $1.5 billion bank that is roughly $750,000 to $1,050,000 a year. Credit unions above $100 million in assets spend a median of about 0.10% to 0.11%.
What big companies spend on marketing