

Tinder spent $180.6 million on user acquisition marketing in 2025, and its parent Match Group told investors it would raise that by $50 million to a budget of about $230 million in 2026. Hinge spent $122.0 million. Bumble Inc. (Bumble and Badoo) recorded $138.4 million of advertising inside $165.5 million of selling and marketing expense. Match Group as a whole reported $625.5 million of selling and marketing. Every figure on this page comes from the companies’ own 10-K, 10-Q and shareholder-letter filings on SEC EDGAR, read in November 2026.
Short answer: Tinder: $180.6 million of marketing (“cost of acquisition”) in 2025, 9.4% of its revenue, with about $230 million planned for 2026. Hinge: $122.0 million (17.7% of revenue). Bumble Inc.: $138.4 million of advertising (14.3% of revenue), down 39% from 2024. Grindr: $11.5 million of advertising (2.6%). Bumble does not split its marketing between the Bumble and Badoo apps.
The brand-level Tinder and Hinge numbers are recent. Since its 2025 annual report, Match Group has published a “significant segment expenses” table under a new accounting rule, and one line in it is cost of acquisition, which Match defines as advertising: search and social media fees, TV and print, and ad production. That table is the first audited answer to “how much does Tinder spend on marketing.” Most pages ranking for that question predate it.
Tinder, Hinge, Bumble, Match Group and Grindr marketing spend compared (2025)
All companies below have a December 31 fiscal year. Spend and revenue in each row come from the same filing. The percentage column is my calculation: spend divided by revenue, times 100.
| App or company | Marketing measure, FY2025 (reported) | Revenue, FY2025 | % of revenue (calc.) | Source |
|---|---|---|---|---|
| Tinder | Cost of acquisition: $180.6M | $1,924.7M (segment) | 9.4% | Match Group 10-K, FY2025 |
| Hinge | Cost of acquisition: $122.0M | $690.9M (segment) | 17.7% | Match Group 10-K, FY2025 |
| Match Group (all brands) | Selling and marketing: $625.5M; advertising: $550.4M | $3,487.2M | 17.9% (S&M); 15.8% (advertising) | Match Group 10-K, FY2025 |
| Bumble Inc. (Bumble, Badoo, BFF) | Selling and marketing: $165.5M; advertising: $138.4M | $965.7M | 17.1% (S&M, as reported); 14.3% (advertising) | Bumble 10-K, FY2025 |
| Bumble app alone | Not disclosed | $783.0M | n/a | Bumble 10-K, FY2025 |
| Grindr | Advertising costs: $11.5M (inside SG&A of $143.3M) | $439.9M | 2.6% | Grindr 10-K, FY2025 |
Two cautions. First, the measures are close but not identical: Match’s segment “cost of acquisition” for its four segments adds up to $569.0 million (my sum), slightly more than the $550.4 million it reports as advertising expense, because cost of acquisition also covers ad production. Second, “selling and marketing” is wider than advertising. It adds marketing staff pay and stock compensation, so it is the closest public number to a full “marketing budget,” while advertising is the closest number to media spend.
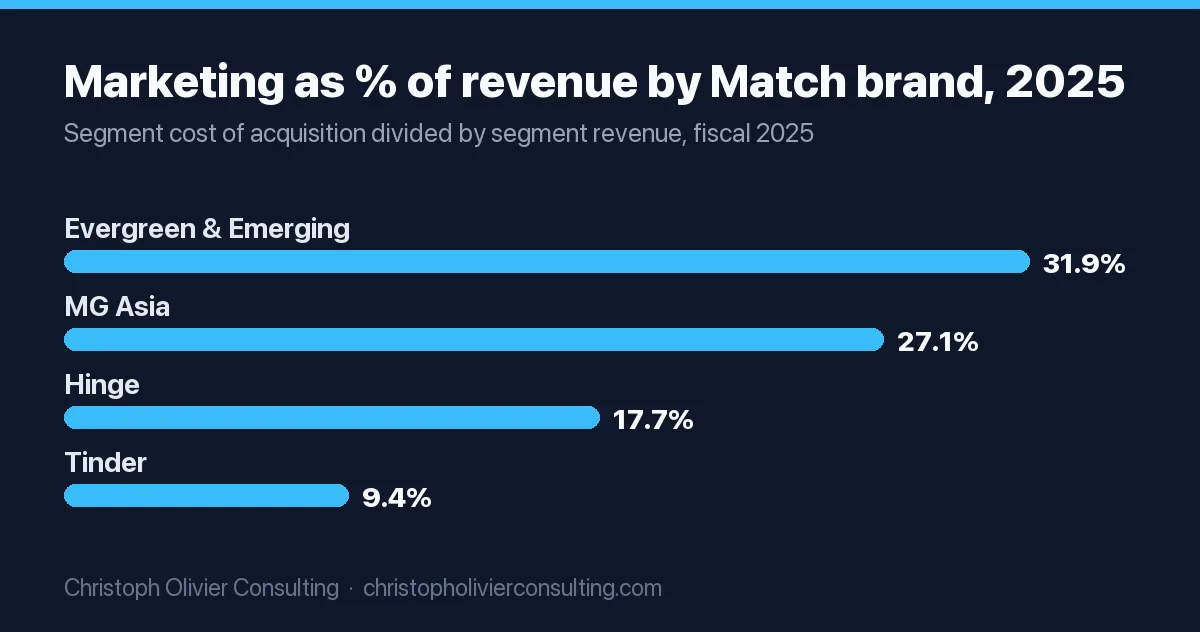
The ratio gap is the story. Tinder, the largest dating app by revenue, spends the smallest share of its revenue on acquisition among Match’s brands. Match’s smaller brands spend far more per revenue dollar: Evergreen & Emerging (Match, Plenty of Fish, OkCupid and others) spent $193.7 million against $608.1 million of revenue, and MG Asia $72.8 million against $268.2 million.
How much does Tinder spend on marketing? $180.6 million in 2025, about $230 million planned for 2026
Tinder’s cost of acquisition was $180.6 million in 2025, $183.2 million in 2024 and $167.6 million in 2023, per the segment expense table in Match Group’s 2025 10-K. Against Tinder segment revenue of $1,924.7 million, that is 9.4% (my calculation).
For 2026, Match’s Q4 2025 shareholder letter (February 3, 2026) says its Tinder guidance “includes a $50 million increase in Tinder marketing spend, for a total budget of approximately $230 million, as we test into marketing to support our product turnaround and user growth efforts.” That is the only explicit Tinder marketing budget Match has published. $180.6 million plus $50 million is $230.6 million, so the letter’s figure lines up with the cost of acquisition line (my inference; the letter does not name the line).
Tinder marketing budget, 2023 to 2026
| Period | Tinder cost of acquisition | Tinder revenue (segment) | % of revenue (calc.) | Source |
|---|---|---|---|---|
| FY2023 | $167.6M | $1,963.6M | 8.5% | Match 10-K FY2025 |
| FY2024 | $183.2M | $1,991.1M | 9.2% | Match 10-K FY2025 |
| FY2025 | $180.6M | $1,924.7M | 9.4% | Match 10-K FY2025 |
| 9 months to Sep 30, 2025 | $140.9M | $1,445.5M | 9.7% | Match 10-Q Q3 2026 |
| 9 months to Sep 30, 2026 | $186.0M | $1,431.6M | 13.0% | Match 10-Q Q3 2026 |
| FY2026 plan | About $230M (budget) | Guided to decline | n/a | Q4 2025 letter |
By September 30, 2026, Tinder had already spent more on acquisition in nine months ($186.0 million) than in all of 2025, up 32% on the same nine months a year earlier (my calculation). Match’s Q3 2026 letter says Adjusted EBITDA was held back “primarily due to higher marketing spend at Tinder and Hinge,” that some planned spend shifted from Q3 into Q4, and that Tinder’s marketing now centers on product features such as Double Date and Events, with more going to creator and social content.
Why the Tinder number is smaller than you might expect
Tinder has not needed paid media to stay large. In Q4 2024, the Q4 2024 letter notes “Tinder’s marketing spend declined $16 million Y/Y.” Match’s 10-K also describes how it buys media: “We spend advertising dollars against an expected lifetime value of a Payer that is realized over a multi-year period,” and that spend “is nearly always negative during the period in which the expense is incurred.” For an established brand, Match says it optimizes “for total return on advertising spend.” In plain terms, Tinder’s budget is capped by payback math, not by ambition, and the 2026 increase is a deliberate test while user numbers fall: Tinder averaged 9.0 million payers in 2025, down 7%.
Hinge marketing budget: $122.0 million in 2025, up 80% since 2023
Hinge’s cost of acquisition rose from $67.8 million in 2023 to $98.8 million in 2024 and $122.0 million in 2025, per the Match 10-K. That is an 80% increase in two years (my calculation), while Hinge revenue grew from $396.5 million to $690.9 million. Hinge spends a larger share of revenue on acquisition than Tinder: 17.1% in 2023, 18.0% in 2024 and 17.7% in 2025 (calculated).
The 2026 pace is faster. Hinge spent $118.1 million on acquisition in the first nine months of 2026, up 36% on $87.1 million a year earlier, per the Q3 2026 10-Q. Match’s Q3 2026 letter says Hinge “increased marketing spend in Q3” in the U.S., tested messaging in secondary markets, and relaunched in India “with marketing and a localized experience.” Before that relaunch, Match said Hinge had built over one million monthly users in India “growing 40% Y/Y without marketing spend” (Q4 2025 letter).
Hinge’s best-known recent creative is the real-couples campaign “It’s Funny We Met on Hinge,” whose second chapter Hinge announced on August 14, 2025, followed by a 2026 chapter titled “Can’t Believe We Met On Hinge.” Neither Hinge nor Match discloses what a single campaign cost.
Match Group marketing spend: $625.5 million of selling and marketing in 2025
Match Group’s selling and marketing expense was $625.5 million in 2025, essentially flat on $622.1 million in 2024, and 18% of revenue by Match’s own rounding (2025 10-K). Advertising expense, stated in the accounting notes, was $550.4 million. Match defines selling and marketing as cost of acquisition plus pay and stock compensation for sales, marketing and PR staff.
| Year | Selling and marketing | Advertising expense | Revenue | S&M % of revenue (calc.) | Source |
|---|---|---|---|---|---|
| 2021 | $566.5M | $510.3M | $2,983.3M | 19.0% | 10-K FY2023 |
| 2022 | $534.5M | $474.9M | $3,188.8M | 16.8% | 10-K FY2023 |
| 2023 | $586.3M | $519.6M | $3,364.5M | 17.4% | 10-K FY2023 |
| 2024 | $622.1M | $546.8M | $3,479.4M | 17.9% | 10-K FY2025 |
| 2025 | $625.5M | $550.4M | $3,487.2M | 17.9% | 10-K FY2025 |
| 9 months 2026 | $506.3M | Not stated in 10-Q | $2,608.3M | 19% (as reported) | 10-Q Q3 2026 |
Match’s nine-month 2026 selling and marketing rose 7%, which the 10-Q attributes to “higher cost of acquisition expense at Tinder and Hinge, partially offset by reductions at E&E.” In other words, the group is moving money from older brands to its two growth brands, while total spend stays near 18% to 19% of revenue.
Bumble marketing budget: $165.5 million in 2025, down 37%
Bumble Inc. reported selling and marketing expense of $165.5 million in 2025, down from $261.2 million in 2024, a cut of 36.7%, and 17.1% of revenue, per its 2025 10-K. The filing attributes the drop mainly to “a $88.6 million decrease in marketing costs.” Advertising expense fell from $227.0 million to $138.4 million.
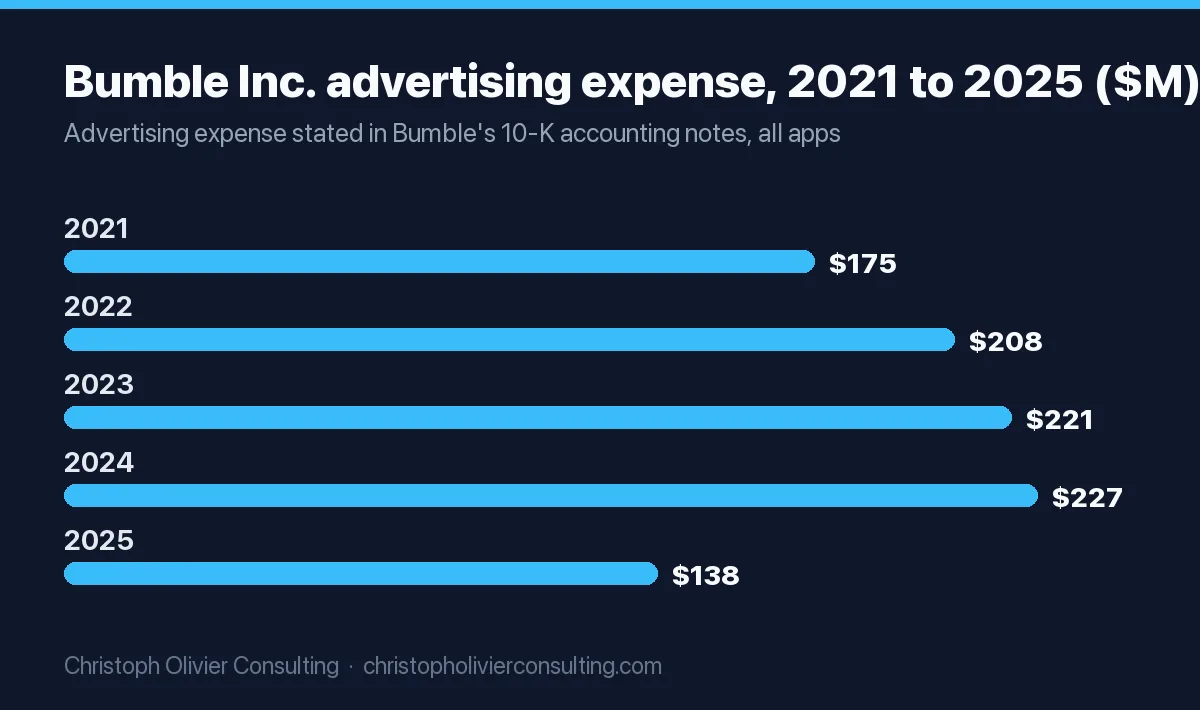
The reason is a strategy change, stated in the same filing: Bumble “strategically shifted away from paid member acquisition in favor of brand and organic investment” and “limited performance marketing to targeted usage aimed at acquiring quality members.” Revenue fell from $1,071.6 million to $965.7 million in the same year, and total paying users from 4.1 million to 3.7 million, so the spend cut and the user decline happened together. The filing presents the decline as partly a product of removing bad actors and cutting paid acquisition; it does not quantify how much of the drop each caused.
| Year | Selling and marketing | Advertising expense | Revenue | S&M % of revenue (reported) | Source |
|---|---|---|---|---|---|
| 2021 | $211.7M | $175.0M | $760.9M | 27.8% | 10-K FY2023 |
| 2022 | $249.3M | $207.7M | $903.5M | 27.6% | 10-K FY2023 |
| 2023 | $270.4M | $221.0M | $1,051.8M | 25.7% | 10-K FY2023 |
| 2024 | $261.2M | $227.0M | $1,071.6M | 24.4% | 10-K FY2025 |
| 2025 | $165.5M | $138.4M | $965.7M | 17.1% | 10-K FY2025 |
| 9 months 2026 | $94.2M | Not stated in 10-Q | $630.0M | 14.9% | 10-Q Q3 2026 |
How much does the Bumble app itself spend on marketing?
Not disclosed. Bumble reports as a single segment and says its chief executive reviews sales and marketing “at the consolidated level,” so there is no Bumble-app versus Badoo split of marketing. What is known: the Bumble app produced $783.0 million of the company’s $965.7 million revenue in 2025 (81%, my calculation), and the 10-K describes the Bumble app’s marketing as “large-scale campaigns alongside hyperlocal IRL (in real life) experiences.”
Bumble’s 2026 marketing: cut, then a planned increase
Selling and marketing for the first nine months of 2026 was $94.2 million, down 24.4% on $124.6 million, per the Q3 2026 10-Q. The third quarter alone went the other way: $38.0 million, up 15.9%, “reflecting the planned acceleration of marketing investments beginning in the third quarter of 2026.” Third-quarter selling and marketing rose to 18.3% of revenue from 13.3%.
Grindr marketing spend: $11.5 million of advertising in 2025
Grindr is the outlier. Its 2025 10-K reports advertising costs of $11.5 million in 2025, up from $8.2 million in 2024 and $2.4 million in 2023 (2024 10-K), against revenue of $439.9 million. That is 2.6% of revenue (my calculation). Grindr does not report a separate selling and marketing line; marketing sits inside selling, general and administrative expense of $143.3 million.
The filing explains why the number is so low: Grindr has grown “mainly through word-of-mouth referrals” and has “not historically relied on traditional advertising for user acquisition.” The 2024 and 2025 increases ($7.1 million and $2.9 million of extra marketing expense, per the 10-K) went “to expand our branding efforts,” not paid acquisition. Average paying users still rose to 1.3 million in 2025 from 1.1 million.
Marketing as a share of revenue, by brand (2025)
The same Match filing lets you compare its four segments on one basis. A mature, dominant brand (Tinder) spends under 10 cents per revenue dollar on acquisition; brands that are growing into new markets (Hinge) or fighting decline (Evergreen & Emerging, MG Asia) spend two to three times that ratio.
| Match segment | Cost of acquisition, 2025 | Segment revenue, 2025 | % of revenue (calc.) |
|---|---|---|---|
| Tinder | $180.6M | $1,924.7M | 9.4% |
| Hinge | $122.0M | $690.9M | 17.7% |
| Evergreen & Emerging | $193.7M | $608.1M | 31.9% |
| MG Asia (Pairs, Azar) | $72.8M | $268.2M | 27.1% |
Source: Match Group 10-K, FY2025, segment note.
App store fees vs marketing: where dating apps’ money actually goes
For the subscription apps, Apple and Google take more than the ad budget. Match paid $687.1 million of in-app purchase fees in 2025 versus $550.4 million of advertising (10-K). At Tinder the gap is wider: $390.4 million of in-app purchase fees against $180.6 million of acquisition spend, about 2.2 times as much (my calculation). These fees sit in cost of revenue, not marketing, so they never appear in “marketing budget” searches.
That gap is now funding marketing. Match’s 10-K says alternative payment options in the U.S. “led to savings in in-app purchase fees in 2025,” and the Q4 2025 letter says Match is “reinvesting savings from last year’s workforce reductions and alternative payments initiative into Tinder and Hinge product and marketing.” In the first nine months of 2026, Tinder’s in-app fees fell to $260.0 million while its acquisition spend rose to $186.0 million (10-Q).
Why third-party “ad spend” estimates look so different
If you have seen much smaller numbers, they are usually measured-media estimates. MediaPost and Global Dating Insights reported MediaRadar estimates that Bumble, eHarmony, Grindr, Hinge, Match.com and Tinder together spent about $147 million through July 31, 2024, with Tinder at $41 million and Bumble at $44 million. Those figures track ad placements in the channels MediaRadar monitors. The 10-K numbers include all paid acquisition worldwide, including app-install and social campaigns, so they run several times higher. Use the filings for the size of the budget and tracker data only for channel mix or timing.
Marketing dollars per paying user: an original comparison
Dividing a year’s marketing spend by the average number of payers gives a rough sense of how much each app spends on marketing for every paying user it carries. This is not customer acquisition cost: payers include long-time renewals, and spend also reaches users who never pay. It is a like-for-like efficiency ratio built only from filed numbers. All calculations are mine.
| App or company, 2025 | Marketing spend | Average payers | Spend per average payer | Monthly revenue per payer | Months of payer revenue to cover it |
|---|---|---|---|---|---|
| Tinder | $180.6M (cost of acquisition) | 9.03M | $20.01 | $17.20 (RPP) | 1.2 |
| Hinge | $122.0M (cost of acquisition) | 1.80M | $67.72 | $31.97 (RPP) | 2.1 |
| Bumble Inc. | $138.4M (advertising) | 3.67M | $37.69 | $21.64 (ARPPU) | 1.7 |
Sources: Match Group 10-K FY2025 (payers, RPP, segment expenses); Bumble 10-K FY2025 (paying users, ARPPU, advertising). Grindr is excluded because its 10-K rounds average paying users to 1.3 million, too coarse for a per-payer figure.
Read it this way: Hinge spends more than three times as much per payer as Tinder, but each Hinge payer also pays nearly twice as much per month. That is the trade Match describes when it says it spends “against an expected lifetime value of a Payer.”
Copy-ready: the payback check dating apps use, applied to your business
The useful lesson for a subscription, retainer or membership business is Match’s rule of spending against lifetime value and accepting a loss in the month of spend. Here is the same check in a form you can copy. If you need the inputs, start with how to calculate customer acquisition cost and your LTV to CAC ratio.
- Marketing spend per new paying client = paid marketing for the period ÷ new paying clients in the period.
- Monthly gross margin per client = monthly revenue per client × gross margin %.
- Payback months = step 1 ÷ step 2.
- Expected client life in months = 1 ÷ monthly churn rate.
- Decision: compare payback months with expected life using the table below.
Worked example (illustrative numbers, not from any filing): a bookkeeping firm spends $9,000 in a quarter and wins 12 clients at $600 a month with 60% gross margin and 3% monthly churn. Spend per client is $750. Monthly margin is $360. Payback is 2.1 months. Expected life is 33 months. That is a pass with room to spend more.
| Payback months vs expected client life | Verdict | What to do next quarter |
|---|---|---|
| Payback under 15% of expected life | Pass: under-spending | Raise budget in steps of 20% to 30% and re-measure, as Tinder is doing in 2026 |
| Payback 15% to 35% of expected life | Pass | Hold budget; shift money toward the channels with the shortest payback |
| Payback 35% to 60% of expected life | Borderline | Cut the weakest channel and fix pricing or onboarding before adding spend |
| Payback over 60% of expected life, or no churn data | Fail | Pause paid acquisition growth; measure churn first, as Bumble did when it cut paid acquisition in 2025 |
The thresholds are my rule of thumb for small service firms, not an industry standard; set your own from your cash position. For the wider budget question, see how to set a marketing budget, and for a second opinion on your numbers you can book a consultation.
Related questions people ask
Is Tinder a profitable company? Tinder is a segment of Match Group, not a separate company. Its segment operating income was $832.6 million in 2025 on $1,924.7 million of revenue, and Match Group’s net income was $613.4 million (Match 10-K FY2025).
Who is bigger, Tinder or Bumble? Tinder. In 2025 Tinder segment revenue was $1,924.7 million versus $783.0 million for the Bumble app, about 2.5 times larger, and Tinder averaged 9.0 million payers versus 2.4 million Bumble app paying users (my comparison of the Match and Bumble 10-Ks). Tinder also spent more on acquisition: $180.6 million against $138.4 million of advertising for all of Bumble Inc.
Can you advertise on Tinder? Match sells some advertising, but it is small: “indirect revenue (principally advertising revenue)” was $72.3 million in 2025, about 2% of Match’s revenue (Match 10-K). Grindr leans on ads more: indirect revenue, including first- and third-party advertising, was 16.7% of its 2025 revenue (Grindr 10-K).
What company has the biggest marketing budget? Among companies that disclose it, Amazon: advertising and other promotional costs of $23.5 billion in 2025, per its 2025 10-K. That is more than 40 times Match Group’s advertising. Other large spenders are compared in big brand marketing budgets, and app-driven peers in Uber, DoorDash and Airbnb marketing spend.
Ready to scale your revenue?
Book a free 30-min consultation. We’ll diagnose your growth bottleneck and map out the 3 highest-leverage moves for your business.
Frequently asked questions
How much does Tinder spend on marketing?
Tinder's cost of acquisition, which Match Group defines as advertising spend, was $180.6 million in 2025, 9.4% of Tinder's $1,924.7 million revenue, per Match's 2025 10-K. Match told investors in February 2026 that it would add $50 million, for a 2026 Tinder marketing budget of about $230 million. Tinder spent $186.0 million in the first nine months of 2026.
What is Hinge's marketing budget?
Hinge spent $122.0 million on cost of acquisition in 2025, up from $98.8 million in 2024 and $67.8 million in 2023, per Match Group's 2025 10-K. That was 17.7% of Hinge revenue. In the first nine months of 2026 Hinge spent $118.1 million, up 36%, as it increased U.S. marketing and relaunched in India.
What is Bumble's marketing budget?
Bumble Inc. reported $165.5 million of selling and marketing expense in 2025, including $138.4 million of advertising, down from $261.2 million and $227.0 million in 2024. The cut followed a shift away from paid member acquisition toward brand and organic marketing. Bumble does not disclose marketing for the Bumble app separately from Badoo.
How much does Match Group spend on marketing?
Match Group reported selling and marketing expense of $625.5 million in 2025, about 18% of its $3,487.2 million revenue, and advertising expense of $550.4 million. Nine-month 2026 selling and marketing rose 7% to $506.3 million, driven by higher acquisition spend at Tinder and Hinge, partly offset by cuts at its older brands.
Does Tinder spend more on marketing than Bumble?
Yes. Tinder's 2025 cost of acquisition was $180.6 million, while all of Bumble Inc., including Badoo, recorded $138.4 million of advertising. As a share of revenue Tinder spends less: 9.4% versus 14.3% for Bumble Inc. These are my calculations from each company's 2025 10-K.
Why do dating apps pay more in app store fees than marketing?
Most subscriptions are bought inside iOS and Android apps, so Apple and Google take a fee. Match paid $687.1 million of in-app purchase fees in 2025 versus $550.4 million of advertising; at Tinder it was $390.4 million versus $180.6 million. Match says it is reinvesting fee savings from alternative payments into Tinder and Hinge marketing.
What big companies spend on marketing