

A physical therapy clinic owner usually earns somewhere between what an employed therapist makes and a few hundred thousand dollars a year, and the gap comes down to how many visits the clinic bills and what each visit pays. Employed physical therapists earned a median of $102,760 in May 2025 (BLS). The average outpatient therapy office with employees took in $890,558 in 2022 (Census SUSB, my calculation). Two public PT chains kept 13.7% to 19.2% of revenue at the clinic level before head office costs.
Short answer: In my worked model built from public data, a PT owner who treats full time pays themselves about $143,000 running a solo clinic, about $210,000 with two employed PTs, and about $351,000 with eight clinicians. Those figures are pre-tax and include the owner’s own treating salary. At low visit volume, owner pay falls to employee level or below. No government survey publishes PT owner income directly, so treat any single “owner salary” number online with caution.
Below are the primary numbers that do exist: Census receipts for therapy offices, BLS wages, Medicare’s 2026 payment rules and the audited clinic economics in the 10-K filings of U.S. Physical Therapy and ATI Physical Therapy. Then I turn them into a labeled P&L you can rerun with your own visit count and rate.
How much do physical therapists make who own their own practice?
No federal dataset reports income for PT practice owners. BLS wage data leaves out the self-employed. The IRS does not give physical therapy its own line in its sole proprietorship tables; PT is folded into “other miscellaneous health practitioners.” What you can measure is the revenue a clinic brings in, the salary an owner would otherwise earn and the share of revenue that public chains keep. Each source below counts a different slice, so read the “what it measures” column first.
| Source and year | What it measures | Figure | How it was calculated |
|---|---|---|---|
| Census SUSB 2022, NAICS 621340 | Revenue per therapy office location with employees (PT, OT, speech and audiology combined) | $890,558 | $45,314,241,000 receipts ÷ 50,883 establishments (my calculation) |
| Census SUSB 2022, NAICS 621340 | Revenue per firm (one firm can run many clinics) | $1,430,058 | Receipts ÷ 31,687 firms (my calculation) |
| Census Nonemployer Statistics 2022, NAICS 62134 | Revenue per therapy business with no paid employees (mostly solo and contract therapists) | $40,264 | $4,083,791,000 ÷ 101,425 businesses (my calculation) |
| BLS Occupational Outlook Handbook, May 2025 | Median wage of employed PTs in offices of PT, OT, speech therapists and audiologists | $97,160 | Published. All employed PTs: $102,760 median |
| U.S. Physical Therapy 10-K, 2025 | Clinic-level gross profit margin, physical therapy operations | 19.2% | Published. 780 clinics in 44 states at year end |
| ATI Physical Therapy 10-K, 2024 | Revenue left after cost of services (salaries, rent, supplies, bad debt) | 13.7% | 100% minus 86.3% cost of services (my calculation from the published share) |
Three things to take from this table:
- The Census code is broader than PT. NAICS 621340 also includes occupational therapy, speech therapy and audiology offices. It is still the closest government revenue count for outpatient PT clinics.
- The $40,264 nonemployer average is not a clinic owner’s income. 91% of those 101,425 businesses are sole proprietors, and 56.2% took in less than $25,000 in 2022 (my calculation). That pattern fits side work and per-diem contracting, not a full-time clinic.
- The public chains pay their therapists first. Their margins come after every clinician has drawn a salary. A private owner who treats patients collects that salary and the margin, which is why owner pay can sit well above the 19% figure.
What a typical PT clinic brings in (the median is far below the average)
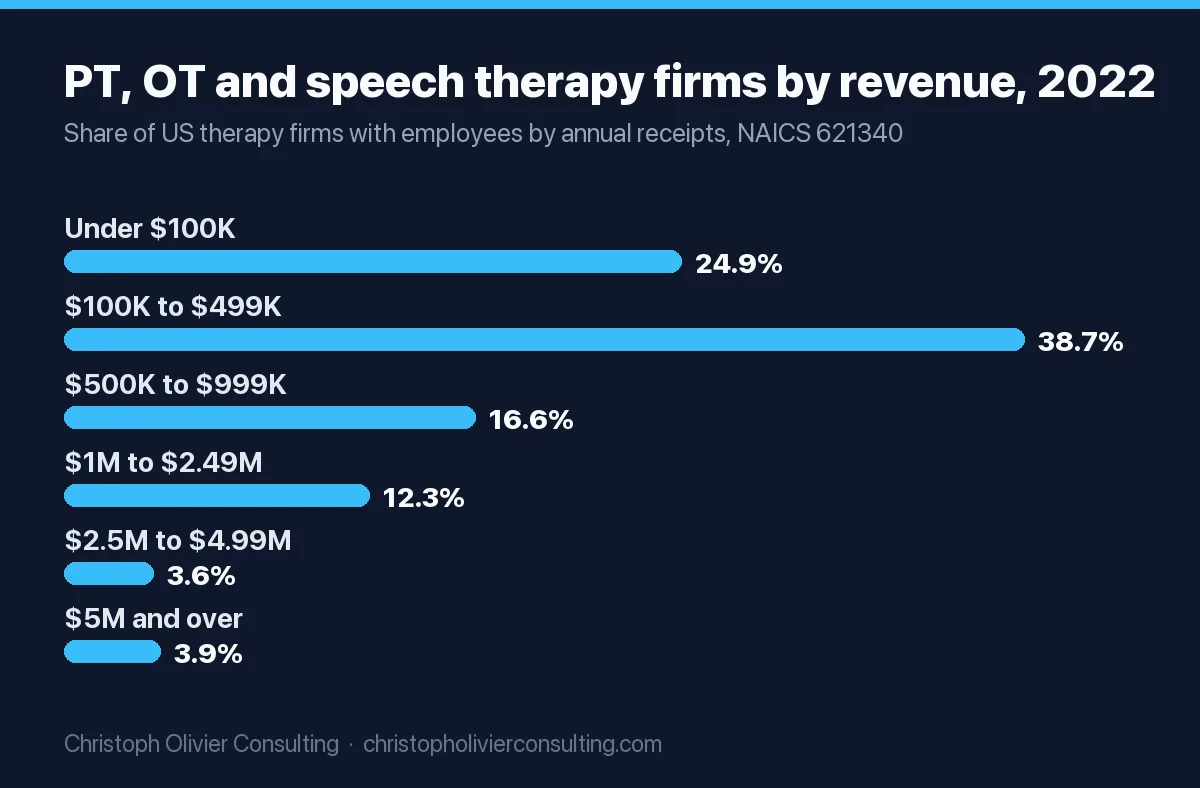
The $1.43 million average per firm is pulled up by a few large chains. Census also publishes firms by annual revenue band. I added the shares and per-firm averages.
| Annual receipts of the firm | Firms | Share of firms | Cumulative share | Average receipts per firm | Employees per firm | Share of all revenue |
|---|---|---|---|---|---|---|
| Under $100,000 | 7,890 | 24.9% | 24.9% | $50,483 | 0.9 | 0.9% |
| $100,000 to $499,999 | 12,259 | 38.7% | 63.6% | $248,885 | 2.8 | 6.7% |
| $500,000 to $999,999 | 5,250 | 16.6% | 80.2% | $706,339 | 7.6 | 8.2% |
| $1 million to $2.49 million | 3,909 | 12.3% | 92.5% | $1,498,533 | 15.8 | 12.9% |
| $2.5 million to $4.99 million | 1,142 | 3.6% | 96.1% | $3,348,567 | 36.9 | 8.4% |
| $5 million and over | 1,237 | 3.9% | 100% | $23,019,191 | 225.9 | 62.8% |
Source: U.S. Census Bureau, SUSB 2022, U.S. 6-digit NAICS by enterprise receipts size, NAICS 621340, released April 10, 2025. Employer firms only. The $5 million and over row combines the published bands above $5 million. Averages, shares and cumulative shares are my calculations.
What the table tells you:
- The median therapy firm takes in between $100,000 and $499,999 a year. 24.9% of firms are under $100,000 and 63.6% are under $500,000, so the midpoint lands in that band. The average firm there collected $248,885 with 2.8 employees.
- Revenue is concentrated. The 1,237 firms with $5 million or more are 3.9% of firms but collect 62.8% of the revenue. The 287 firms above $100 million alone run 13,188 locations, a quarter of all therapy offices.
- Payroll is the biggest cost. Payroll was 48.3% of receipts across the industry in 2022 ($21.87 billion of $45.31 billion, my calculation). That figure is wages only, before payroll taxes and benefits.
Average PT office revenue by state
Average receipts per therapy office location ranged from about $545,000 to $1.35 million by state in 2022. These are the six highest and six lowest from the SUSB 2022 state file (receipts ÷ establishments, NAICS 621340, employer offices only, my calculation):
| State | Therapy offices with employees | Average receipts per office | Payroll as share of receipts |
|---|---|---|---|
| Texas | 3,229 | $1,352,996 | 50.5% |
| Louisiana | 739 | $1,246,687 | 45.1% |
| Ohio | 1,164 | $1,145,082 | 55.2% |
| Michigan | 1,634 | $1,131,475 | 42.6% |
| Pennsylvania | 2,252 | $1,059,778 | 48.8% |
| Missouri | 904 | $1,047,045 | 40.2% |
| United States | 50,883 | $890,558 | 48.3% |
| Florida | 4,148 | $641,304 | 44.9% |
| Utah | 459 | $609,678 | 48.7% |
| Idaho | 496 | $588,883 | 46.4% |
| Vermont | 132 | $554,258 | 53.9% |
| Montana | 258 | $553,934 | 46.5% |
| Maine | 279 | $545,258 | 46.9% |
A high state average often means bigger multi-therapist offices, not higher pay per visit. Compare your clinic to offices with similar headcount, not just your state line.
Physical therapy clinic owner salary: owner pay is salary plus profit
“Owner salary” mixes two different paychecks. Keep them apart, or you will misread your own books:
- The clinician wage. What it would cost to hire someone to do the treating you do. For a PT in an outpatient office that is the BLS median of $97,160 (May 2025). The lowest 10% of all PTs earned under $77,140 and the top 10% over $135,140.
- The owner return. What is left after every clinician, including you at market rate, plus rent, billing and bad debt are paid. This is the real return on the risk and capital you put in.
U.S. Physical Therapy pays its clinic partners the same way. Its 2025 10-K says the managing therapist usually owns the minority limited partnership interest in a clinic. The company typically holds 65% to 75%. The therapist partner “receives a base salary and may receive a bonus” plus “earnings distributions based upon their ownership interest.” Salary for the work, distributions for the ownership: that is the right way to read any PT owner’s income.
The test is simple. If owner pay minus $97,160 is close to zero, you own a job, not a business. If it is negative, you would earn more as an employee.
Worked P&L: what a 1, 3 and 8 clinician PT clinic owner makes
This is my own calculation, not a survey result. Each input comes from a published source or is labeled as an assumption, so you can swap in your own numbers.
| Line (own calculation) | Solo: owner PT + 1 front desk | 3 clinicians: owner + 2 PTs, front desk, aide | 8 clinicians: owner (half load) + 5 PTs + 2 PTAs, 2 front desk, 2 aides |
|---|---|---|---|
| Patient visits per year | 2,585 | 7,755 | 19,270 |
| Net patient revenue | $273,390 | $820,169 | $2,008,633 |
| Employed PTs ($97,160 wage × 1.429 load) | $0 | $277,625 | $694,063 |
| PTAs ($68,380 × 1.429) | $0 | $0 | $195,389 |
| Front desk ($38,010 × 1.429) | $54,305 | $54,305 | $108,610 |
| PT aides ($35,240 × 1.429) | $0 | $50,347 | $100,695 |
| Rent, supplies, contract labor, other (18.0% of revenue) | $49,159 | $147,476 | $361,175 |
| Billing, software, insurance, accounting, marketing (8.9%) | $24,245 | $72,734 | $178,130 |
| Bad debt (1.0%) | $2,677 | $8,031 | $19,667 |
| Owner pay (salary + profit, pre-tax) | $143,004 | $209,650 | $350,903 |
| Owner pay as share of revenue | 52.3% | 25.6% | 17.5% |
| Owner pay above an employed PT’s $97,160 | $45,844 | $112,490 | $253,743 |
| Census revenue band this clinic falls in | $100K to $499K (median band) | $500K to $999K | $1M to $2.49M |
Assumptions and where each comes from:
- Revenue per visit: $105.76. U.S. Physical Therapy’s net rate per patient visit for 2025 (10-K). ATI reported $109.08 for 2024. A small clinic with weaker payer contracts may collect less, so see the sensitivity table below.
- PTA visits: $100.08. Medicare pays 85% of the fee schedule amount for services furnished in whole or in part by a PTA (the CQ modifier, CMS). I applied that 15% cut to the 35.8% Medicare/Medicaid share of USPH revenue. This is my approximation; Medicaid and commercial rules vary by plan.
- 11 visits per clinician per day, 235 treating days. These are assumptions. The 235 days are ATI’s 255 business days in 2024 minus 20 days of leave and continuing education. Check: the 3-clinician clinic sees 33 visits a day, close to USPH’s 32.2 average daily visits per clinic in 2025 and above ATI’s 28.2 in 2024. In the 8-clinician model the owner treats 5 a day and manages the rest of the time.
- Wages: BLS May 2025 medians: PT in therapy offices $97,160, PTA $68,380 and PT aide $35,240, receptionist $38,010.
- 1.429 load for payroll tax and benefits: private employers paid $46.89 an hour in total compensation for $32.82 in wages in June 2026 (BLS Employer Costs for Employee Compensation, my ratio).
- Overhead ratios from the USPH 2025 income statement: rent, supplies, contract labor and other were 18.0% of net revenue, corporate office costs were 8.9% ($69.26 million of $780.99 million) and credit losses were 1.0%. I use the corporate share as a proxy for what a private owner pays outside firms for billing, software, accounting, insurance and marketing.
- Not included: owner’s health insurance and retirement, loan payments on build-out or equipment, depreciation and income tax. Year-one numbers will be lower while the caseload builds.
How visits and rate change owner pay
Same model, varying only visits per clinician per day and net revenue per visit. Left number: solo clinic. Right number: 3-clinician clinic. The $95 and $115 rates are scenarios, not reported figures.
| Visits per clinician per day | $95 per visit | $105.76 per visit (USPH 2025) | $115 per visit |
|---|---|---|---|
| 9 | $90,706 / $52,754 | $107,130 / $102,027 | $121,234 / $144,339 |
| 11 | $122,930 / $149,427 | $143,004 / $209,650 | $160,243 / $261,365 |
| 13 | $155,155 / $246,101 | $178,879 / $317,273 | $199,251 / $378,392 |
The row that matters is the top one. At 9 visits a day and $95 a visit, hiring two PTs cuts owner pay from $90,706 to $52,754, because each hire costs about $138,800 loaded and brings in only about $201,000. Growth pays only when employed clinicians are fully booked. In my view this is why marketing for a PT clinic should be measured in filled visit slots per clinician, not leads. The cost-per-patient playbook for PT clinics shows that math.
Physical therapy clinic profit margins
The only audited margins for outpatient PT come from public companies. They are the floor for a well-run private clinic, because they pay every therapist a salary and then carry head office costs.
| Measure | U.S. Physical Therapy, 2025 | ATI Physical Therapy, 2024 |
|---|---|---|
| Clinics at year end | 780 in 44 states | 866 in 24 states |
| Net revenue per patient visit | $105.76 | $109.08 |
| Average daily visits per clinic | 32.2 | 28.2 |
| Salaries and related costs, share of net revenue | 59.1% | 55.5% |
| Rent, supplies, contract labor and other | 18.0% | 28.7% |
| Clinic-level margin (gross profit) | 19.2% | 13.7% (my calculation) |
| Margin after head office costs | 10.3% (my calculation, before interest, earn-outs and tax) | 0.5% after SG&A of 13.2% (my calculation, before impairments, interest and tax) |
Sources: U.S. Physical Therapy Form 10-K for 2025, filed February 27, 2026; ATI Physical Therapy Form 10-K for 2024, filed March 18, 2025. ATI deregistered with the SEC in March 2025, so 2024 is its last public year.
How to read these against your own clinic:
- A 15% to 20% margin after paying yourself a market salary is a healthy clinic. That is the range the two chains reach at the clinic level.
- Rent and contract labor separate good from weak. ATI spent 28.7% of revenue on rent, supplies, contract labor and other, against USPH’s 18.0%. The 10.7-point gap is most of the difference in their clinic margins.
- Scale does not fix low visit volume. ATI ran more clinics than USPH and finished with almost nothing after overhead. Visits per clinic per day matter more than clinic count.
For how PT compares with other healthcare and service businesses, see the profit margin benchmarks for 94 industries and the same analysis for chiropractic practice owners, the closest neighboring profession, and for dental practices.
Where revenue per visit comes from: payers and Medicare rules for 2026
Your rate per visit is set by payer mix and billing rules, not by you. The two chains disclose their mix:
| Payer | U.S. Physical Therapy, 2025 (share of net patient revenue) | ATI Physical Therapy, 2024 |
|---|---|---|
| Commercial and managed care | 48.5% | 58.7% |
| Medicare and Medicaid | 35.8% | 22.2% |
| Workers’ compensation | 10.2% | 11.8% |
| Other (mostly auto and personal injury for ATI) | 5.5% | 7.3% |
The Medicare rules that move PT revenue in 2026:
- Conversion factor: $33.40 for clinicians not in a qualifying alternative payment model, up 3.26% from $32.35 in 2025. Qualifying APM participants get $33.57, per the CMS fact sheet on the CY 2026 Physician Fee Schedule final rule. Each PT code’s Medicare payment is its geographically adjusted relative value units times this number.
- KX modifier threshold: $2,480 for PT and speech-language pathology combined in 2026, with a $3,000 targeted medical review threshold (CMS therapy services page). Above $2,480, claims without the KX modifier and medical-necessity documentation are denied.
- PTA payment: 85% of the normal fee schedule amount for services furnished in whole or in part by a PTA. This is why PTA-heavy staffing models earn less per visit than they appear to on paper.
What is the 8 minute rule in physical therapy?
It is Medicare’s rule for counting timed 15-minute codes such as therapeutic exercise (97110). Under the Medicare Claims Processing Manual, chapter 5, section 20.2, you bill one unit for 8 through 22 minutes, two for 23 through 37, three for 38 through 52 and four for 53 through 67. A single service under 8 minutes is not billed. It matters for owner pay because units per visit, multiplied by every visit in the year, set most of your Medicare revenue. Documented minutes that miss a threshold lose a unit.
What is the highest paying job in physical therapy?
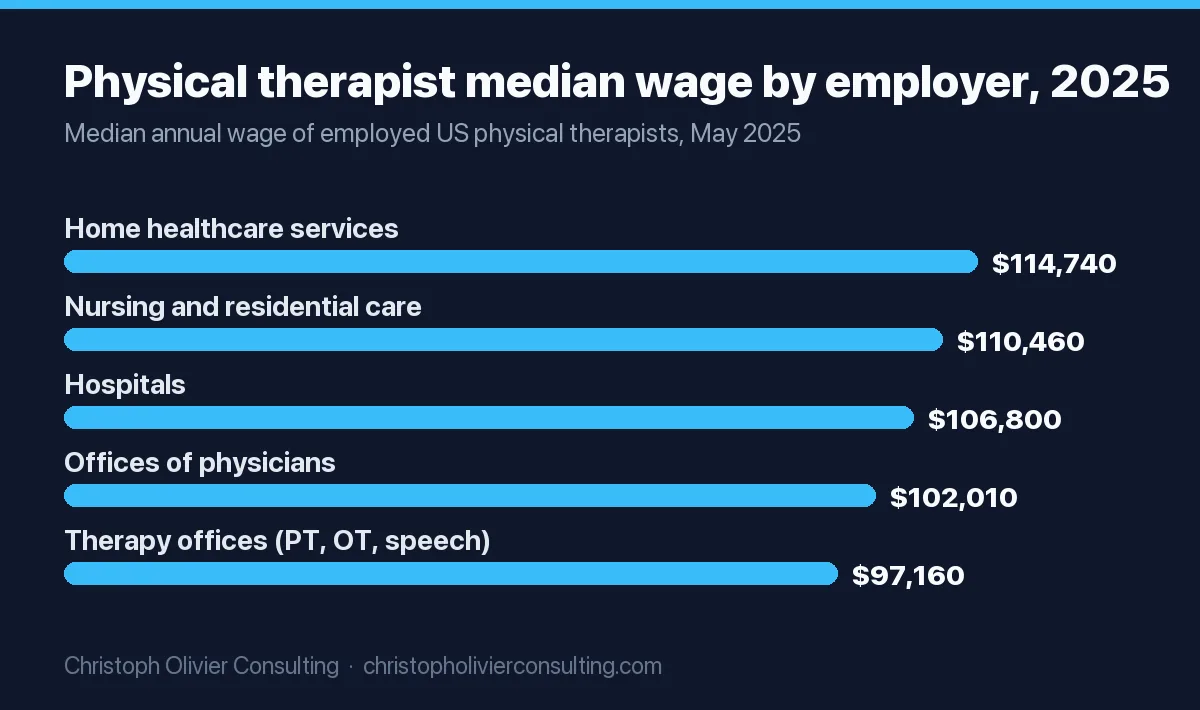
Among employed PTs, setting matters more than title. BLS medians for May 2025 by employer type:
| Employer type | Median annual wage, May 2025 | Share of PT jobs |
|---|---|---|
| Home healthcare services | $114,740 | 11% |
| Nursing and residential care facilities | $110,460 | 6% |
| Hospitals (state, local and private) | $106,800 | 26% |
| Offices of physicians | $102,010 | 6% |
| Offices of PT, OT, speech therapists and audiologists | $97,160 | 36% |
Source: BLS Occupational Outlook Handbook, Physical Therapists. 283,700 PT jobs in 2025; employment projected to grow 12% from 2025 to 2035.
Outpatient clinic employees earn the least of the five settings. That matters for an owner in two ways. Your hiring cost is lower than a hospital’s. But a strong clinician can move to home health for about $17,600 more at the median. The upside above these figures sits with ownership. In my 8-clinician model, the owner makes about $351,000, well above the top 10% wage of $135,140.
How much does it cost to open your own physical therapy clinic?
No government source publishes PT clinic startup costs. The best public figures are franchise disclosure documents, where Item 7 lists a franchisor’s estimated initial investment. FYZICAL Therapy & Balance Centers’ 2025 FDD puts it at $167,850 to $418,600 for a new center run by a licensed professional, and $217,850 to $518,600 for a center with a hired clinical director, as reported by PeerSense. Those totals include a $49,000 franchise fee, and royalties run at least 6% of gross revenue. I could not open the FDD itself, so check Item 7 in the current document before you rely on it.
An independent clinic avoids the fee and royalty but pays the same build-out, equipment, credentialing and working capital costs. Budget working capital for a slow start: your first year will look like the 9-visit row of the sensitivity table, not the 11-visit row. If you are buying a clinic rather than starting one, the USPH 10-K notes that acquired practices usually keep the prior owner as a salaried manager with a minority stake. That is a common exit path, and it values the clinic on profit, which is one more reason to separate your salary from your profit now.
Owner pay worksheet: run your own numbers
Copy this into a spreadsheet. Each line has a pass/fail check taken from the benchmarks above.
| Step | Formula | Pass if |
|---|---|---|
| 1. Visits per clinician per day | Billed visits ÷ treating days ÷ clinicians | 11 or more (at 9, the 3-clinician model paid the owner less than solo) |
| 2. Net revenue per visit | Collections (not charges) ÷ visits | Within 10% of $105.76 (USPH 2025) |
| 3. Revenue per loaded clinician | Revenue from one clinician ÷ that clinician’s wage × 1.429 | 1.8 or higher. In the model, a hire lowered owner pay at 1.6 (9 visits at $105.76) and raised it at 1.8 (11 visits at $95) |
| 4. Rent, supplies, contract labor | Those costs ÷ net revenue | At or below 18% (USPH); 28.7% (ATI) is a warning |
| 5. Market salary for your own treating | Your treating hours ÷ full time × $97,160 × 1.429 | Booked as a cost before profit |
| 6. True profit margin | (Revenue minus all costs including step 5) ÷ revenue | 15% to 20% (USPH and ATI clinic-level range) |
| 7. Owner pay | Step 5 wage + true profit | Above $97,160 by enough to pay for your risk and capital |
If step 1 or step 2 fails, adding clinicians or locations multiplies the problem. Fix referral flow and payer contracts first. If you want an outside view of where your clinic’s new-patient math breaks, you can book a consultation.
Ready to scale your revenue?
Book a free 30-min consultation. We’ll diagnose your growth bottleneck and map out the 3 highest-leverage moves for your business.
Frequently asked questions
How much does a physical therapy clinic owner make?
No government survey reports PT owner income. In a model built from Census, BLS, CMS and 10-K data, an owner who treats full time earns about $143,000 pre-tax in a solo clinic, about $210,000 with two employed PTs and about $351,000 with eight clinicians. At 9 visits a day and $95 per visit, solo owner pay drops to about $91,000, below the $97,160 median wage of employed outpatient PTs.
What is the average physical therapy clinic owner salary?
There is no published average. Think of owner pay as two parts: a market salary for the treating you do, which is $97,160 at the BLS median for PTs in therapy offices (May 2025), plus the clinic's profit after every cost. U.S. Physical Therapy pays its therapist partners the same way: a base salary and bonus, plus earnings distributions based on their ownership share.
What are typical physical therapy clinic profit margins?
Audited figures come only from public chains. U.S. Physical Therapy reported a 19.2% clinic-level gross margin in 2025 and about 10.3% after corporate office costs (my calculation). ATI Physical Therapy kept 13.7% after cost of services in 2024 and about 0.5% after SG&A. A private owner's margin looks higher because it includes the owner's own treating salary.
How much revenue does a physical therapy clinic make?
Therapy offices with employees averaged $890,558 per location in 2022 ($45.31 billion across 50,883 offices, Census SUSB, NAICS 621340, my calculation). The median firm is smaller: 63.6% of firms took in under $500,000, and the typical firm falls between $100,000 and $499,999. The code also includes OT, speech and audiology offices.
How much does it cost to open a physical therapy clinic?
No government source publishes startup costs. FYZICAL's 2025 franchise disclosure document estimates an initial investment of $167,850 to $418,600 for a new center run by a licensed professional and $217,850 to $518,600 with a clinical director, as reported by PeerSense. Those totals include a $49,000 franchise fee. Independent clinics skip the fee but face similar build-out and working capital costs.
What type of physical therapist makes the most money?
Among employed PTs, home health pays the most: a $114,740 median in May 2025, followed by nursing and residential care at $110,460 and hospitals at $106,800. Outpatient therapy offices pay the least of the main settings at $97,160 (BLS). Practice owners with several fully booked clinicians can earn well above the top 10% wage of $135,140.
What is the 8 minute rule in physical therapy?
It is Medicare's rule for billing timed 15-minute codes, set out in the Medicare Claims Processing Manual, chapter 5, section 20.2. You bill one unit for 8 through 22 minutes, two units for 23 through 37, three for 38 through 52 and four for 53 through 67. A single timed service under 8 minutes is not billed.
Practice economics benchmarks