

A pipeline forecasting process needs six parts: stages with written exit criteria, forecast categories (Pipeline, Best Case, Commit, Closed) mapped to those stages, a weekly rep to manager to CRO submission cadence with saved snapshots, at least two forecasting methods you compare against each other, a forecast accuracy number you track every quarter, and hygiene rules the CRM flags automatically. Each part below is built for you to copy: the category definitions as Salesforce and HubSpot write them, a forecast call agenda, worked math on one example pipeline, a forecast for upcoming events, a tool validation checklist with verified prices, and a spreadsheet layout with formulas.
The running example: a professional-services firm with a $600,000 quarterly bookings target ($2.4 million a year), a $30,000 average deal, a 60-day sales cycle and a 25% trailing win rate. It is week 5 of a 13-week quarter and $120,000 has already closed. Every example input is illustrative. Swap in your own.
What a pipeline forecasting process should include: the RevOps checklist
If you are the RevOps lead, this is the list to hold the process against. Each line has a test you can run this week.
| Component | What done looks like | Pass test | Owner |
|---|---|---|---|
| 1. Stage definitions | 5 to 7 stages, each with an exit criterion that needs evidence in the CRM | Two managers put the same deal in the same stage without talking | RevOps |
| 2. Forecast categories | Pipeline, Best Case, Commit, Closed, plus Omitted or Not forecasted, mapped from stage with written override rules | Every open deal with a close date in the period has a category | RevOps and sales leader |
| 3. Submission cadence | Reps submit Monday, managers roll up Tuesday, CRO call Wednesday | A snapshot of every submission is saved weekly | Sales leader |
| 4. Methods | Weighted pipeline, category call and run-rate, side by side | Methods land within 15% of each other, or the gap is explained deal by deal | RevOps |
| 5. Accuracy | Week-8 forecast vs actual every quarter, MAPE over the trailing 4 quarters | The number sits on a dashboard, with a written formula | RevOps and finance |
| 6. Coverage and velocity | One written formula each | Sales and marketing reports show the same number | RevOps |
| 7. Hygiene | Automated flags for stale close dates, missing next steps, inactivity and pushes | Under 10% of Commit deals flagged by Wednesday | Front-line managers |
| 8. Event and campaign inputs | Planned pipeline from upcoming events kept in a plan tab, not as fake CRM deals | Plan vs actual reviewed 30 and 60 days after each event | Marketing ops |
The 15% and 10% thresholds are my rules of thumb, not published benchmarks. If the function itself is not set up yet (lifecycle definitions, one CRM, a metric dictionary), start with the 13-week foundation plan in our revenue operations guide, then come back to forecasting.
Build the pipeline: stages with exit criteria and stage-to-close rates
A forecast is only as honest as the stage field. Name each stage after a buyer action you can prove, then attach a default forecast category to it.
| Stage | Exit criterion (move only when true) | Evidence in the CRM | Default category | Example stage-to-close rate |
|---|---|---|---|---|
| 1. Discovery held | Need, budget range, decision process and timeline confirmed on a held call | Meeting logged; four discovery fields filled | Pipeline | 25% |
| 2. Scoped | Scope call held with the decision maker present | Decision maker contact role set on the deal | Pipeline | 40% |
| 3. Proposal reviewed | Proposal walked through live, not just emailed | Review meeting logged; amount equals proposal total | Best Case | 56% |
| 4. Negotiation | Verbal yes; open items are terms, not whether to buy | Redline or written list of open terms attached | Commit | 77% |
| 5. Contract sent | Signature requested from the named signer | E-signature envelope sent | Commit | 91% |
| Closed won / Closed lost | Signed, or lost with a reason picked from a list | Closed-lost reason picklist required | Closed / Omitted | 100% / 0% |
How to calculate stage-to-close rates from your own CRM: take every deal that closed, won or lost, in the last 4 quarters. For each stage, count how many deals reached it and how many of those were won. In the example, 80 closed deals reached Discovery held and 20 were won (25%). 50 reached Scoped (20 ÷ 50 = 40%), 36 reached Proposal reviewed (56%), 26 reached Negotiation (77%) and 22 reached Contract sent (91%). Exclude open deals, or the rates come out too low.
Until you have that history, CRM defaults are placeholders. HubSpot’s default sales pipeline ships with Appointment scheduled at 20%, Qualified to buy 40%, Presentation scheduled 60%, Decision maker bought-in 80% and Contract sent 90%, and uses each stage probability to calculate the weighted amount in board view (HubSpot Knowledge Base). In Salesforce, each Stage picklist value carries its forecast category, so you edit the mapping on the Opportunity Stage field (Salesforce Ben). The evidence rule is the same one our investor pipeline system for fund managers uses: “they sounded keen” is never an exit criterion.
Forecast categories: Pipeline, Best Case, Commit and Closed, defined
Salesforce defines a forecast category as “the category within the sales cycle to which an opportunity is assigned based on its opportunity stage.” Its standard categories are Pipeline, Best Case, Commit, Omitted (“not included in forecasts”) and Closed, and admins can add Most Likely in Lightning Experience (Salesforce Help, Customize Pipeline Forecast Categories). HubSpot’s forecast tool, available on Sales Hub or Service Hub Professional and Enterprise, maps categories from deal stages per pipeline and judges them “based on the sequential order of the forecast categories, not the forecast category’s name” (HubSpot Knowledge Base, Set up the forecast tool).
| Category | HubSpot’s definition | Salesforce cumulative column it feeds | Entry rule to write into your process |
|---|---|---|---|
| Pipeline | “Deals that have a low likelihood of closing” | Open Pipeline | Close date in the period; stage 1 or 2 |
| Best Case | “Deals that will close in the best case scenario, which have a moderate likelihood of closing” | Open Pipeline and Best Case Forecast | Proposal reviewed live; the rep can name the one event that must happen, and by what date |
| Commit | “Deals that have a high likelihood of closing and have been committed to the forecast” | Open Pipeline, Best Case Forecast and Commit Forecast | Verbal yes or contract out; signer named; paper process known; at least 5 business days between expected signature and period end |
| Closed (HubSpot: Closed won) | “Deals that have closed within the forecasted time period” | Best Case Forecast, Commit Forecast and Closed Only | Signed contract, per your revenue policy |
| Omitted (HubSpot: Not forecasted) | “Deals that are in the pipeline for the current time period, but are not included in the forecast” | None | Lost, on hold, or no dated next step |
The entry rules in the last column are my recommendations. The cumulative logic comes from Salesforce: Open Pipeline adds Pipeline, Best Case and Commit; Best Case Forecast adds Best Case, Commit and Closed; Commit Forecast adds Commit and Closed; Closed Only is closed deals. Salesforce’s own example uses four Pipeline, three Best Case, two Commit and one Closed opportunity at $50 each, which shows as $450 Open Pipeline, $300 Best Case Forecast, $150 Commit Forecast and $50 Closed Only (Salesforce Help, cumulative forecast rollups). Note that Open Pipeline excludes closed deals.
Applied to the example quarter: Closed $120,000; Commit $150,000 (Negotiation $90,000 plus Contract sent $60,000); Best Case $150,000 (Proposal reviewed); Pipeline $420,000 (Discovery held $240,000 plus Scoped $180,000). So the Commit Forecast is $270,000, the Best Case Forecast is $420,000 and Open Pipeline is $720,000.
The weekly forecast cadence: rep to manager to CRO
This is the rhythm I recommend for a team with one sales leader and two to fifteen sellers. The days matter less than the order: reps commit first, managers adjust second, the CRO calls the number last.
- Monday by noon, rep submission (15 minutes per rep). Fix every hygiene flag, update close dates and next steps, set the category on each deal, and submit one number: Commit Forecast plus any Best Case deal the rep names as upside. HubSpot can show a submission status indicator; it defaults to eight days and can be set up to thirty-one (HubSpot).
- Tuesday, manager roll-up (30 minutes per rep). Inspect every Commit deal against its entry rule and each Best Case deal over the average deal size. Record the manager’s number separately from the rep’s. In Salesforce, when forecast adjustments are enabled, those columns appear as My Best Case and My Commit (Salesforce Help), which keeps rep judgment and manager judgment apart.
- Wednesday, CRO forecast call (45 minutes). Agenda below.
- Thursday, RevOps snapshot. Save a copy of every deal’s amount, stage, category and close date, plus each team’s submitted call. Without this you cannot measure week-8 accuracy, and you cannot see what moved.
CRO call agenda, ready to paste into the invite:
| Minutes | Item | Question that must be answered |
|---|---|---|
| 0 to 5 | The number | Commit Forecast, Best Case Forecast and the call vs target; change since last week |
| 5 to 20 | What moved | Which deals entered or left Commit, which close dates were pushed, which hygiene flags are still open |
| 20 to 35 | The three biggest Best Case deals | What must happen, by when, and who owns it |
| 35 to 40 | Next quarter | Open pipeline for next quarter vs required coverage |
| 40 to 45 | Decisions | Owner and date for each action; the call submitted to finance |
Why the week-8 snapshot: the BoostUp and RevOps Co-op report (November 14, 2024, more than 1,200 revenue professionals) found that teams reaching at least 82% forecast accuracy by week 8 of the quarter were significantly more likely to hit targets, and that teams with formal forecasting and sales processes had a 67% higher chance of reaching revenue goals (BoostUp press release, archived). It is a survey, so read it as association, not proof.
Forecasting methods with worked math
1. Weighted pipeline by stage probability
Multiply each in-period deal by its stage probability and add closed revenue. Here it is with HubSpot’s defaults and with the example’s own stage-to-close rates.
| Stage | Open, closing this quarter | Default probability | Weighted | Your stage-to-close | Weighted |
|---|---|---|---|---|---|
| Discovery held | $240,000 | 20% | $48,000 | 25% | $60,000 |
| Scoped | $180,000 | 40% | $72,000 | 40% | $72,000 |
| Proposal reviewed | $150,000 | 60% | $90,000 | 56% | $84,000 |
| Negotiation | $90,000 | 80% | $72,000 | 77% | $69,300 |
| Contract sent | $60,000 | 90% | $54,000 | 91% | $54,600 |
| Open total | $720,000 | $336,000 | $339,900 | ||
| Plus closed to date | $120,000 | $456,000 | $459,900 |
The blind spot is timing. Stage-to-close rates say whether a deal closes, not when. With a 60-day cycle and 56 days left in the quarter, most Discovery held deals will land next quarter. Drop them and the weighted forecast is $339,900 minus $60,000 plus $120,000, or $399,900.
2. Category call with historical hit rates
From your saved snapshots, measure what share of each category, as it stood at week 5, actually closed inside the quarter. Example inputs: 90% of Commit, 45% of Best Case, 8% of Pipeline.
Call = $120,000 closed + ($150,000 × 0.90) + ($150,000 × 0.45) + ($420,000 × 0.08) = $120,000 + $135,000 + $67,500 + $33,600 = $356,100.
3. Run-rate and time series
Two quick reads. Trailing average: the last four quarters booked $520,000, $560,000, $610,000 and $540,000, an average of $557,500. Linearity: if, historically, 25% of a quarter’s bookings had closed by the end of week 5, then $120,000 ÷ 0.25 = $480,000. With two or more years of data, add a seasonal index (same quarter last year ÷ that year’s quarterly average) and multiply it in.
4. AI forecasting tools
AI forecasts learn from your history, so check the data they need before you pay for them.
- HubSpot AI projections (Sales Hub or Service Hub Professional and Enterprise, in beta) use closed-won deals from the past three months, return a Most likely, Upper and Lower range, refresh on days 1, 7, 14, 21 and 28 of each month, and score themselves with Accuracy = 1 minus |Actual minus Forecast| ÷ Actual (HubSpot Knowledge Base).
- Salesforce Einstein Forecasting requires Collaborative Forecasting enabled, a standard fiscal year, forecasts measured by opportunity revenue, a hierarchy with at least one forecasting user who reports to a forecast manager, and opportunities in Salesforce for at least 24 months (Salesforce Einstein features cheat sheet, updated April 2024).
- Gong Forecast says it uses “300+ unique signals to predict deal outcomes” (Gong). That is a vendor claim with no published method; test it with the backtest in the buyer checklist below.
Triangulate before you call the number
| Method | Forecast | Share of $600,000 target |
|---|---|---|
| Weighted, your stage-to-close rates | $459,900 | 77% |
| Weighted, excluding deals that cannot close in time | $399,900 | 67% |
| Category call with hit rates | $356,100 | 59% |
| Run-rate linearity | $480,000 | 80% |
| Trailing four-quarter average | $557,500 | 93% |
Do not average these. When the in-quarter methods disagree by more than 15% (here $356,100 to $480,000), find the source. The weighted and category methods differ deal by deal: Scoped deals count at 40% in weighted math but at the 8% Pipeline hit rate in the category call, and Proposal reviewed deals at 56% against 45%. Walk those deals on Wednesday. The run-rate read sits above both, which means this quarter’s pipeline is thinner than usual or deals are being created later in the quarter. A defensible call here is about $400,000, with the $200,000 gap to plan stated out loud rather than hidden in Best Case.
How to forecast pipeline from upcoming events
Forecast event pipeline as a planned line outside the CRM forecast: expected leads × lead-to-MQL rate × MQL-to-SQL rate × average deal size gives pipeline created, and multiplying by the SQL-to-won rate gives bookings. Then shift both by your follow-up lag and sales cycle. Use your own history first: for the last three events of the same type, count the opportunities created within 60 days per 100 leads. Until you have that, the only public per-channel rates come from First Page Sage.
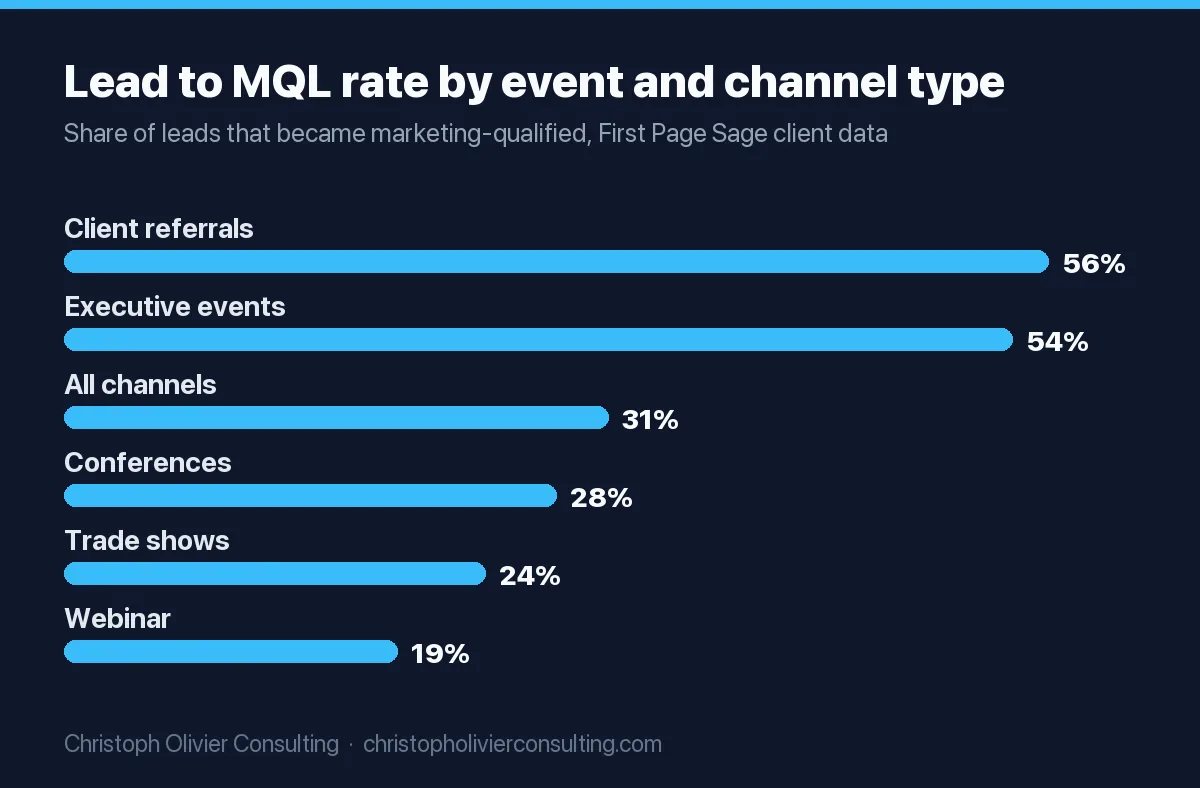
The example below uses First Page Sage’s lead-to-MQL rates by channel (updated August 1, 2025), its IT and managed services MQL-to-SQL rate of 13% (2019 to 2025 data) and its 20% SQL-to-closed-won rate for the same industry (2019 to 2025 data), plus the example’s $30,000 deal size.
| Upcoming event | Expected leads | Lead to MQL | MQLs | SQLs (× 13%) | Pipeline created (× $30,000) | Bookings (× 20%) |
|---|---|---|---|---|---|---|
| Webinar | 250 registrants | 19% | 47.5 | 6.2 | $185,250 | $37,050 |
| Trade show booth | 300 badge scans | 24% | 72 | 9.4 | $280,800 | $56,160 |
| Executive dinner | 20 attendees | 54% | 10.8 | 1.4 | $42,120 | $8,424 |
| Total | 130.3 | 16.9 | $508,170 | $101,634 |
Timing is where event forecasts go wrong. With a 60-day cycle, an event in month 1 creates pipeline in months 1 and 2 and books revenue mostly in month 3 or the next quarter. Put the planned pipeline in the month it should be created and the bookings one cycle later.
Sanity checks for the inputs:
- Webinar registrations. Goldcast’s 2026 report on 26,190 webinars from 522 B2B organizations in 2025 found 251 registrants and 102 attendees per event on average, and a 40% attendance rate (Goldcast). If you plan 250 registrants, you are planning an average webinar, not a weak one. Univid puts the average attendee-to-CTA click rate at 22% on webinars with a CTA button (Univid, 2,000+ webinars, January 2023 to August 2026), which is a useful early read on whether the MQL rate will hold. More attendance data is in our webinar statistics.
- Source caveat. First Page Sage is an SEO agency reporting its own client data, about 70% B2B, without stated sample sizes. Our lead generation statistics page shows its full stage chain by industry. Treat it as a placeholder until you have three events of your own.
- Follow-up speed. Event MQLs convert only if someone calls them. Write the event follow-up into the same response SLA you use for inbound, as set out in our inbound sales process.
Never create placeholder opportunities in the CRM for events that have not happened. They inflate Open Pipeline and corrupt your stage-to-close history. Keep the plan in a separate tab, tag real opportunities to the event campaign when they are created, and compare plan to actual at 30 and 60 days.
Forecast accuracy: the formula, MAPE and what good looks like
Forecast accuracy = 1 minus |forecast minus actual| ÷ actual. It is the same formula our RevOps guide uses and the one HubSpot applies to its AI projections. MAPE (mean absolute percentage error) is the average of |forecast minus actual| ÷ actual across periods (Hyndman and Athanasopoulos, Forecasting: Principles and Practice). Measure both at a fixed point, such as the week-8 snapshot, or you are grading a forecast against itself.
| Quarter | Week-8 forecast | Actual | Absolute % error | Accuracy | Signed error |
|---|---|---|---|---|---|
| Q1 | $500,000 | $520,000 | 3.8% | 96.2% | minus 3.8% |
| Q2 | $600,000 | $560,000 | 7.1% | 92.9% | plus 7.1% |
| Q3 | $580,000 | $610,000 | 4.9% | 95.1% | minus 4.9% |
| Q4 | $590,000 | $540,000 | 9.3% | 90.7% | plus 9.3% |
| Trailing 4 | MAPE 6.3% | 93.7% average | Bias plus 1.9% |
MAPE tells you how far off you are. The signed average (bias) tells you which way. Here the team over-forecasts slightly, and both misses over 7% were optimistic. That points at Commit entry rules, not at the method. One limit: percentage errors are undefined when the actual is zero (FPP3), so do not compute MAPE per rep per month for a rep who sometimes closes nothing.
Targets. The only published benchmark with a stated sample is the BoostUp survey’s 82% by week 8, above. My rule of thumb for a team with two years of clean stage data: week-8 accuracy of 90% or better (MAPE under 10%), and if bias is positive two quarters in a row, recalibrate the stage-to-close rates and tighten Commit. These targets are mine, not sourced.
Pipeline coverage and velocity: the two checks before every call
These formulas match our pipeline marketing guide word for word, so sales and marketing use the same arithmetic.
- Pipeline coverage ratio = open qualified pipeline for the period ÷ remaining target for the period. Example: $720,000 ÷ ($600,000 minus $120,000) = $720,000 ÷ $480,000 = 1.5x.
- Required coverage is about 1 ÷ win rate, so 4x at 25%. The cycle-adjusted version from Salesforce’s Jason Jordan is annual quota ÷ win rate ÷ (365 ÷ cycle days) (Salesforce, April 25, 2023). Example: $2,400,000 ÷ 0.25 ÷ (365 ÷ 60) = $9,600,000 ÷ 6.083 = about $1,578,000 open across all close dates at any one time. Jordan’s point: 3x “works only when your win rate is exactly 33% and your sales cycle is exactly one year.”
- Pipeline velocity = (opportunities x win rate x average deal size) ÷ sales cycle length in days (Salesforce, March 12, 2024). Example with 48 open opportunities across all close dates ($1,440,000): (48 x 0.25 x $30,000) ÷ 60 = $6,000 a day, about $546,000 over a 91-day quarter.
Read together, the checks agree with the forecast. Velocity says the engine runs at about $546,000 a quarter, close to the $557,500 trailing average. Total open pipeline of $1,440,000 is about $138,000 short of the $1,578,000 the Jordan formula asks for. Hitting $600,000 a quarter at the same win rate, deal size and cycle needs ($600,000 ÷ 91 × 60) ÷ (0.25 × $30,000) = about 53 open opportunities, five more than today. If the closers are already full, the question becomes whether a prospector is the fix; our guide on when to hire an SDR has the pass/fail triggers.
Benchmarks to sanity-check your inputs (all in our B2B sales statistics):
- 48% of account executives were at quota in 2026, down from 51% in 2024; median AE quota $960,000; ramp to full productivity 6.2 months (Bridge Group, 158 B2B companies, Q1 to Q2 2026). A rep hired this quarter adds almost nothing to this quarter’s forecast.
- 44% of deals were pushed back; when a deal slipped, win rates fell 67%; more than 7 days of inactivity with no future activity cut win rates by 65% (Ebsta and Pavilion 2024 B2B Sales Benchmarks, 4.2 million opportunities, 530 companies). These are relative changes, not absolute win rates.
- SQL-to-closed-won runs from 12% (B2B SaaS) to 20% (IT and managed services) in First Page Sage’s client data, where an SQL has already met a salesperson (First Page Sage).
Pipeline forecasting tool buyer guide: what to validate before you buy
Validate the process before the tool. A forecasting tool automates your stages and categories; if they are not written down, it automates the confusion. Then run these tests during the trial, on your own data, not the vendor’s demo org.
| What to validate | How to test it in the trial | Pass | Fail |
|---|---|---|---|
| 1. Category and hierarchy fit | Load your stage-to-category map and manager hierarchy | Your categories and roll-ups work without custom code | Needs paid services to map categories |
| 2. Backtest on your history | Ask the vendor to reproduce your last 4 quarters at week 8 and score them with 1 minus |F minus A| ÷ A | Beats the MAPE of your current method | Only customer quotes or “up to” accuracy claims |
| 3. Data requirements | Ask for the minimum history in writing | You meet it today (Einstein Forecasting: 24 months; HubSpot AI projections: closed-won deals from the past 3 months) | You need another year of data first |
| 4. Snapshots and “what changed” | Ask for a week-over-week diff at deal level | Shows which deals moved category, amount or close date, and who changed them | Current-state dashboards only |
| 5. Override audit | Make a manager adjustment, then find the log | Rep number, manager number and model number stored separately | Adjustments overwrite the rep’s submission |
| 6. CRM sync | Edit a close date in the CRM and time how long the tool takes to show it; edit in the tool and check write-back | Minutes, both directions | Nightly, one way |
| 7. Total cost | Get a quote for every forecasting user, including managers and view-only finance users | All-in annual price in writing, including platform and onboarding fees | Platform fee or onboarding appears after the demo |
| 8. Owner after go-live | Name the internal person who maintains categories and hit rates | Named owner with hours a week budgeted | “The vendor’s CSM” |
| 9. Vendor continuity | Check recent mergers and rebrands | Written product roadmap for the module you buy | Product folded into another brand with no roadmap |
Prices, checked November 1, 2026 on each vendor’s US page:
| Tool | Forecasting in the plan | Price (USD) |
|---|---|---|
| HubSpot Sales Hub Professional | “Default and custom forecasting and reporting”; AI projections in beta | From $90 per seat per month billed annually ($100 monthly), plus $1,500 one-time required onboarding (HubSpot pricing) |
| HubSpot Sales Hub Enterprise | Adds “forecasting across team hierarchies” | From $150 per seat per month, plus $3,500 one-time required onboarding |
| Salesforce Pro Suite | “Sales Quoting and Forecasting” | $100 per user per month, billed annually (Salesforce pricing) |
| Salesforce Sales Cloud Core | “Advanced pipeline management and forecasting, opportunity scoring” | $195 per user per month, billed annually; Revenue Intelligence add-on from $220 per user per month |
| Gong Forecast | Two tiers, Forecast Essentials and Forecast; AI deal and revenue predictors, forecast submission | Quote only: “Licenses are priced per user” plus “a platform fee based on the number of users supported” (Gong pricing) |
| Clari Forecast | Now sold by Salesloft; clari.com redirects to salesloft.com. Salesloft said on September 2, 2026 that Clari Forecast “retains the Clari name” (Salesloft newsroom) | Quote only; the Salesloft pricing page lists no prices |
| BoostUp | boostup.ai/pricing now redirects to terret.ai, which sells Terret Forecast; the login still points to app.boostup.ai | No prices listed; Terret offers a free 48-hour proof of concept |
Salesforce’s Collaborative Forecasts, including the categories above, is available in Professional, Performance, Developer, and Enterprise and Unlimited Editions with Sales (Salesforce Help). How I would choose: if you already pay for HubSpot Professional or a Salesforce edition with forecasting, run the native forecast for two quarters with the cadence above, then buy a dedicated tool only if its backtest beats your native MAPE. If you want a second opinion on the stage map before you sign anything, you can book a consultation.
Copy-ready forecast spreadsheet (Google Sheets or Excel)
Four tabs. Formulas are written for row 2; fill down.
Tab “Stages” (A1:E6 with headers in row 1): A Stage, B Default probability, C Closed deals that reached the stage (last 4 quarters), D Of those, won, E Stage-to-close =IFERROR(D2/C2,B2). The IFERROR falls back to the default until you have history.
Tab “Deals”, one row per open opportunity:
| Column | Header | Entry or formula |
|---|---|---|
| A | Deal | Text |
| B | Owner | Dropdown of rep names |
| C | Amount | Number, equal to the latest proposal |
| D | Stage | Dropdown from Stages!A2:A6 |
| E | Category | Dropdown: Pipeline, Best Case, Commit, Omitted |
| F | Close date | Date |
| G | Next step | Text |
| H | Next step date | Date |
| I | Last activity date | Date |
| J | Stage entered date | Date |
| K | Close date pushes | Number |
| L | Probability | =IFERROR(VLOOKUP(D2,Stages!$A$2:$E$6,5,FALSE),0) |
| M | Weighted | =C2*L2 |
| N | In period | =AND(F2>=Summary!$B$1,F2<=Summary!$B$2) |
| O | Days in stage | =TODAY()-J2 |
| P | Hygiene flag | =IF(OR(F2<TODAY(),H2=””,H2<TODAY(),TODAY()-I2>7,K2>=2),”FIX”,”OK”) |
Tab “Summary”: B1 period start, B2 period end, B3 target, B4 closed won to date. Then:
- Open in period: =SUMIFS(Deals!C:C,Deals!N:N,TRUE)
- Weighted forecast: =B4+SUMIFS(Deals!M:M,Deals!N:N,TRUE)
- Commit: =SUMIFS(Deals!C:C,Deals!E:E,”Commit”,Deals!N:N,TRUE)
- Best Case: =SUMIFS(Deals!C:C,Deals!E:E,”Best Case”,Deals!N:N,TRUE)
- Pipeline: =SUMIFS(Deals!C:C,Deals!E:E,”Pipeline”,Deals!N:N,TRUE)
- Commit Forecast: =B4+Commit cell; Best Case Forecast: =B4+Commit cell+Best Case cell
- Category call: =B4+Commit*0.9+BestCase*0.45+Pipeline*0.08 (replace the hit rates with your own)
- Coverage: =Open in period/(B3-B4)
- Commit deals flagged: =COUNTIFS(Deals!E:E,”Commit”,Deals!P:P,”FIX”)/COUNTIF(Deals!E:E,”Commit”)
Tab “History”: A Quarter, B Week-8 forecast, C Actual, D Accuracy =1-ABS(B2-C2)/C2, E Absolute % error =ABS(B2-C2)/C2. MAPE: =AVERAGE(E2:E5). Bias: =SUMPRODUCT((B2:B5-C2:C5)/C2:C5)/COUNT(C2:C5). Add a fifth tab, “Event plan”, with the event table above and one row per upcoming event.
Pipeline hygiene checklist: pass or fail before every forecast call
| Check | Pass | Fail, and the fix | Why it matters |
|---|---|---|---|
| 1. Close date | Today or later | In the past: rep sets a new date with a reason, or closes the deal | Past-dated deals silently drop out of period reports |
| 2. Next step | Written, with a future date | Blank or overdue: move to Omitted until rebooked | Undated next steps are the main cause of the inactivity below |
| 3. Activity (Best Case and Commit) | Logged in the last 7 days | Older: manager call with the rep before Wednesday | Over 7 days of inactivity with no future activity cut win rates 65% (Ebsta and Pavilion) |
| 4. Close date pushes | Fewer than 2 | 2 or more: cannot sit in Commit | Slipped deals saw win rates fall 67% (Ebsta and Pavilion) |
| 5. Days in stage | At or under 2x the median for that stage | Over: re-qualify against the exit criterion | Rule of thumb; catches stalled deals before they push |
| 6. Exit evidence | The stage’s evidence field is filled | Missing: move back one stage | Keeps stage-to-close rates honest |
| 7. Amount | Matches the latest proposal | Blank or a guess: update from the proposal | Weighted math multiplies whatever is there |
| 8. Commit entry rule | Signer named, paper process known, 5 business days of slack | Any missing: move to Best Case | Commit is a promise, not a probability |
| 9. Closed lost reason | Picked from a list | Blank or “other”: fix within 48 hours | Loss reasons feed next quarter’s qualification |
| 10. Ghost deals | Activity in the last 30 days | None: close as lost, reason “no response” | Ghosts inflate coverage and make 1.5x look like 3x |
Checks 1 to 4 are the spreadsheet’s hygiene flag; build the rest as CRM reports or required properties. Run the list Monday morning, before reps submit, so Wednesday’s call is about deals, not data.
Ready to scale your revenue?
Book a free 30-min consultation. We’ll diagnose your growth bottleneck and map out the 3 highest-leverage moves for your business.
Frequently asked questions
As a RevOps lead, what should a pipeline forecasting process include?
Six parts: stages with written exit criteria, forecast categories (Pipeline, Best Case, Commit, Closed, Omitted) mapped to those stages, a weekly rep to manager to CRO submission cadence with saved snapshots, at least two methods compared side by side, a forecast accuracy number tracked each quarter at a fixed week, and hygiene flags for stale close dates, missing next steps, inactivity and pushed deals.
What should a pipeline forecasting tool buyer guide help me validate before I buy?
Test the tool on your own data: that your categories and hierarchy load without custom code, a backtest of your last four quarters at week 8 that beats your current MAPE, the minimum data history in writing, deal-level week-over-week snapshots, separate rep and manager numbers with an audit log, two-way CRM sync in minutes, an all-in quote and a named internal owner.
How do I forecast pipeline from upcoming events?
Multiply expected leads by lead-to-MQL, MQL-to-SQL and average deal size to get pipeline created, then by SQL-to-won for bookings, and shift both by follow-up lag and sales cycle. Use your last three events of the same type first. Keep the plan in a separate tab, not as placeholder CRM deals, and compare plan to actual at 30 and 60 days.
What are the best practices for sales pipeline forecasting?
Move deals only on evidence-based exit criteria, write entry rules for Commit and Best Case, have reps submit before managers adjust, save a weekly snapshot, compare weighted, category and run-rate forecasts instead of trusting one, measure accuracy at week 8 with 1 minus the absolute error divided by actual, and fix hygiene flags before every forecast call.
What is the difference between Commit and Best Case in a sales forecast?
HubSpot defines Commit as deals with a high likelihood of closing that have been committed to the forecast, and Best Case as deals with a moderate likelihood that close in the best case scenario. In Salesforce cumulative rollups, the Commit Forecast is Commit plus Closed, and the Best Case Forecast adds Best Case deals on top of that.
What is a good sales forecast accuracy?
A BoostUp and RevOps Co-op survey of more than 1,200 revenue professionals found teams reaching at least 82% accuracy by week 8 were significantly more likely to hit target. As a rule of thumb, a team with two years of clean stage data should aim for 90% or better at week 8, which is a MAPE under 10%, and watch bias direction.
How much pipeline coverage do I need?
Roughly 1 divided by your win rate, so 4x at 25% and about 3.3x at 30%. The cycle-adjusted formula from Salesforce's Jason Jordan is annual quota divided by win rate divided by (365 divided by cycle days). For $2.4 million at 25% with a 60-day cycle, that is about $1.58 million of open pipeline at any one time.
More in Sales Process
Related articles in this cluster
More Growth, Strategy & Sales guides
- Small Business Advertising Ideas That Actually Bring In Customers
- The 9 Types of Customers (and How to Handle Each One)
- Types of Sales: The 9 Models a Service Business Actually Chooses Between
- VP of Sales vs Head of Sales vs Sales Director
- How to Run a Webinar That Books Sales
- What Is B2B Sales? Modern Definition
- All Sales Process & CRM guides →