

The restaurant marketing statistics that matter most right now: U.S. restaurants and bars sold $92.9 billion in September 2026, up 7.0% from a year earlier (U.S. Census Bureau, October 15, 2026), while restaurant menu prices rose 3.5% over the same 12 months (BLS CPI, October 14, 2026). The National Restaurant Association forecasts $1.55 trillion in 2026 sales but only 1.3% real growth, after 42% of operators said they were not profitable in 2025. In that market, the marketing levers diners say they respond to are value, loyalty membership and direct ordering.
Every figure below names its publisher and the date it describes. Vendor data (Toast, DoorDash, Uber, BrightLocal, Bloom, Paytronix, TextUs) is labeled as vendor data. If you only need one number for a slide or an article, jump to the “Which number to cite” table near the end.
The 12 restaurant marketing statistics to know in 2026
| Statistic | Number | Source and date |
|---|---|---|
| Food services and drinking places sales, September 2026 (seasonally adjusted) | $92.9B, +7.0% YoY | Census Advance Monthly Retail Trade, Oct 15, 2026 |
| Food away from home price inflation, 12 months to September 2026 | +3.5% | BLS CPI, Oct 14, 2026 |
| Projected U.S. restaurant and foodservice sales, 2026 | $1.55T (real growth 1.3%) | NRA State of the Restaurant Industry, Feb 2026 |
| Operators not profitable in 2025 | 42% | NRA, Feb 2026 |
| Delivery customers who say loyalty membership matters when choosing | 70% | NRA, Feb 2026 |
| Delivery customers who say discounts or value promotions matter | 81% | NRA, Feb 2026 |
| Adults who order delivery at least once a week | 37% (60% of Gen Z) | NRA, Feb 2026 |
| Delivery customers who would rather order directly from the restaurant | 56% | NRA, Feb 2026 |
| Diners who discover new restaurants by word of mouth | 38% | Toast survey, Oct 2025 (vendor) |
| Consumers who will only use a business rated 4 stars or higher | 68% | BrightLocal, Feb 2026 (vendor, all local businesses) |
| DoorDash Q2 2026 total orders | 970M, +27% YoY (+17% excluding Deliveroo) | DoorDash SEC filing, Aug 5, 2026 |
| Third-party delivery commission, standard tiers | 15% to 30% per delivery order | DoorDash and Uber Eats merchant pricing, Oct 2026 |
Restaurant sales and prices: the latest monthly numbers
The National Restaurant Association’s annual forecast is the number most articles quote, but it is a projection made in February. For a current read, use the Census Bureau’s monthly retail report, which covers NAICS 722, food services and drinking places.
| Measure (NAICS 722 unless noted) | Value | Change |
|---|---|---|
| September 2026 sales, seasonally adjusted (advance estimate) | $92.906B | +1.1% vs August; +7.0% vs September 2025 |
| July to September 2026 sales | n/a | +6.0% vs same period 2025 |
| January to September 2026 sales, not seasonally adjusted | $807.3B | +4.4% vs same period 2025 |
| Food away from home CPI, September 2026 | n/a | +3.5% over 12 months; +0.2% vs August |
| Full service meals and snacks CPI | n/a | +3.8% over 12 months |
| Limited service meals and snacks CPI | n/a | +3.2% over 12 months |
| Food at home CPI (grocery comparison) | n/a | +1.8% over 12 months |
Sources: Census Advance Monthly Sales for Retail and Food Services, September 2026 (released October 15, 2026; next release November 17, 2026) and BLS CPI Table 2, September 2026.
Worked example: how much of that growth is real? Census sales are not adjusted for price changes. Divide nominal growth by price growth: 1.070 / 1.035 = 1.034, so roughly 3.4% of the September increase came from more spending in real terms rather than higher menu prices. This is a rough calculation of mine, not an official figure, because the CPI tracks prices diners pay, not each restaurant’s sales mix. It is still a useful sanity check against claims that “restaurant sales are booming.”
Two more context numbers from the NRA’s February 2026 release: the industry expects to reach 15.8 million jobs in 2026, and 60% of operators reported softer customer traffic in 2025. The menu-price gap matters for marketing too: restaurant prices (+3.5%) are rising nearly twice as fast as grocery prices (+1.8%), which is the backdrop for diners’ focus on value.
Restaurant customer statistics: who is eating out, and how often
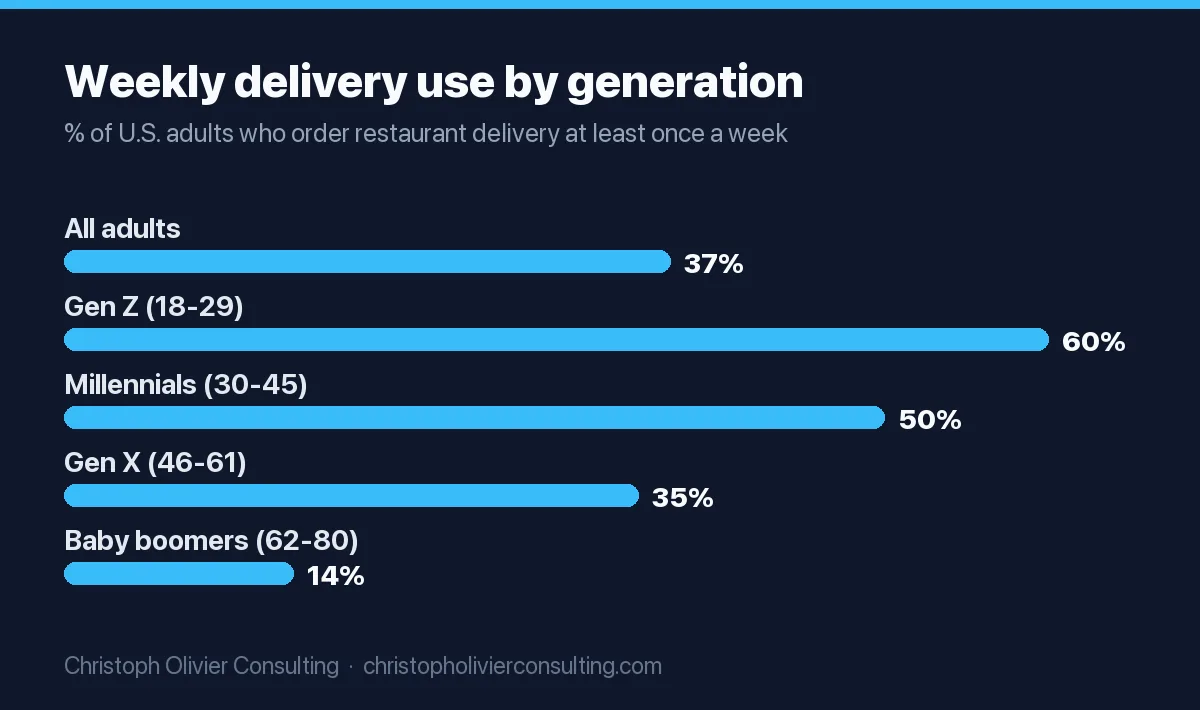
All figures in this section come from the 2026 State of the Restaurant Industry report (National Restaurant Association, February 2026; the full report is $349 for nonmembers on restaurant.org). The NRA defines Gen Z adults as 18 to 29, millennials 30 to 45, Gen X 46 to 61 and baby boomers 62 to 80.
- 61% of adults say restaurants are an essential part of their lifestyle.
- Restaurants take 53% of the household food dollar.
- More than 7 in 10 consumers say they would use restaurants more often if they had the money.
- In a November 2025 NRA survey, 49% of adults said they were struggling to keep up with basic expenses. Among them, 54% still ordered takeout or delivery and 53% still went out to eat.
- Frequency fell in 2025: 43% of delivery customers and 44% of full-service diners said they were doing it less often than a year earlier, against 26% and 17% doing it more often.
- Operators agree: 61% of full-service and 64% of limited-service operators reported lower traffic in 2025 than in 2024.
How often customers use takeout, drive-thru and delivery
| Used at least once a week | All adults | Gen Z | Millennials | Gen X | Boomers |
|---|---|---|---|---|---|
| Takeout | 47% | 57% | 59% | 44% | 33% |
| Drive-thru | 42% | 54% | 55% | 41% | 26% |
| Delivery | 37% | 60% | 50% | 35% | 14% |
| Never order delivery | 22% | 5% | 10% | 21% | 43% |
Source: NRA, 2026 State of the Restaurant Industry. Base: all adults.
The marketing implication is in the bottom row: a delivery-first campaign misses 43% of boomers entirely, while it reaches the majority of Gen Z customers every week. Your channel mix should follow your guest age mix, not an industry average.
How diners discover restaurants: social media and review statistics
The most recent large discovery survey is Toast’s blind survey of 1,466 U.S. adults, fielded October 9 to 15, 2025, as reported by PMQ Pizza. This is vendor research (Toast sells restaurant software). Toast’s own page blocked our fetcher, so we cite the published summary.
| Discovery channel | Share of U.S. adults |
|---|---|
| Word of mouth | 38% |
| In person (walking or driving past) | 30% |
| 27% | |
| TV ads | 18% |
| Map apps | 18% |
| Search engine results | 16% |
| 15% | |
| YouTube | 15% |
| TikTok | 14% (38% of Gen Z name it their favorite) |
The same survey found 64% of respondents tried a new restaurant in the past month (up from 39% in 2024) and ordered from an average of 3.3 restaurants in the past month. What converts them: price or value (55%), food quality (51%), menu variety (43%) and location or convenience (43%).
Restaurant social media statistics
Facebook (27%) still outranks Instagram, YouTube and TikTok for discovery across all adults, but TikTok is the top channel for Gen Z at 38%. Map apps (18%) and search (16%) together rival Facebook, which is why your Google Business Profile listing and map presence deserve as much attention as your posting calendar. Our local SEO statistics page covers map-pack behavior in more depth.
Review and rating statistics
BrightLocal’s Local Consumer Review Survey (1,002 U.S. adults, published February 11, 2026; all local businesses, not restaurants only) is the best recent read on review behavior:
- 97% read online reviews; 41% always do, up from 29%.
- 68% will only use a business rated 4 stars or higher (up from 55%); 31% require 4.5 or higher.
- 47% will not use a business with fewer than 20 reviews; 74% look for reviews from the past three months.
- Google is used by 71% for reading reviews (down from 83%), AI tools such as ChatGPT by 45% (up from 6%), Apple Maps by 27%.
- For writing reviews: Google 45%, Facebook 34%, Yelp 24%, Apple Maps 17%, Tripadvisor 16%.
- 80% are more likely to use a business that responds to all its reviews; 19% now expect a same-day reply.
Restaurant-specific rating benchmarks come from Bloom Intelligence, a guest-data vendor, across 1,000+ locations on its network (reviews dated September 27, 2025 to September 26, 2026): average Google rating 4.57, median location 4.46, top 10% at 4.81 or higher. Average Yelp rating on the same network was 4.24, OpenTable 4.63. Only 33.1% of Google reviews carried an owner reply; the top quartile replied to 66.1% or more. Put the two sources together and the threshold is clear: a 4.4 average on Google is below the typical restaurant, even though it clears the 4-star cutoff most consumers use. If you need a process for raising volume, see how to get more Google reviews within Google’s rules, and for cross-industry data our online review statistics.
Restaurant loyalty, value and SMS benchmarks
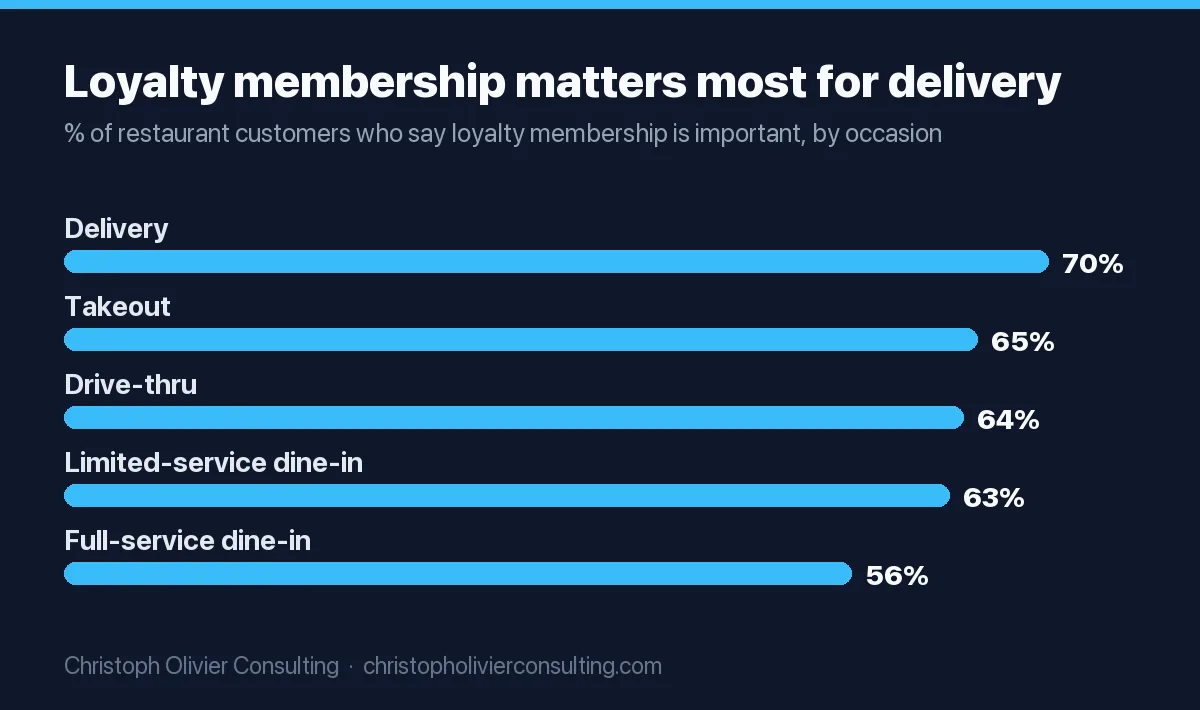
The NRA’s 2026 consumer data shows loyalty membership and value offers influence choice on every occasion, and most strongly for delivery.
| Occasion | Loyalty membership is important | Discount or value promotion is important |
|---|---|---|
| Delivery | 70% | 81% |
| Takeout | 65% | 76% |
| Drive-thru | 64% | 74% |
| Limited-service dine-in | 63% | 75% |
| Full-service dine-in | 56% | 70% |
Source: NRA, 2026 State of the Restaurant Industry. Base: consumers who used each occasion in the past 6 months. Among boomers, loyalty matters for only 39% of full-service visits, versus 66% for Gen Z.
Program health, from named vendors:
- Paytronix 2026 Loyalty Report (April 2026, nine restaurant and convenience concepts, as summarized by eCommerceNews): beverage and snack, specialty, sandwich and Mexican concepts had active rates of 66% to 72%; casual dining fell below a 50% active rate for the first time; in bar and grill, nearly three in four new members did not return within 90 days.
- Bloom Intelligence (vendor network, 2025 to 2026): 78.12% of guests visited only once. Of guests who returned, 42.3% came back within 30 days and 69.0% within 90 days. Blast emails brought back 0.27% of recipients; welcome and win-back emails brought back 6.5% to 7.2%, measured by verified return visits.
- TextUs (December 2025, food and beverage SMS): average click-through rate 12% to 14%, response rate 28% to 38%, delivery rate 98% to 99%. TextUs does not publish its sample, so treat these as planning ranges.
The pattern across all three: sign-ups are easy, second visits are the hard part, and triggered messages tied to a guest’s first visit outperform blasts by a wide margin. Our loyalty program design guide covers how to build that second-visit offer without giving away margin, and the SMS marketing statistics page has cross-industry text benchmarks.
Delivery and off-premises statistics
Off-premises is now the majority of restaurant traffic outside full service. Technomic data cited in the NRA’s 2026 report puts off-premises at 35.4% of full-service customer traffic in 2025 (12.1% in 2019) and 89.9% of limited-service traffic (74.1% in 2019).
- 62% of limited-service and 40% of full-service operators offer delivery.
- Among operators that offer delivery, 69% say it creates more opportunities and 31% more challenges (37% of full-service operators say challenges).
- 75% of delivery customers ordered through a third-party service in the past 6 months (87% of Gen Z, 51% of boomers).
- Yet 56% of delivery customers would rather order directly through the restaurant, rising to 80% of boomers. 56% of Gen Z prefer the third-party app.
- 44% would rather have a restaurant employee deliver their order, versus 26% who prefer a third-party driver.
Source: NRA, 2026 State of the Restaurant Industry, February 2026.
How has restaurant delivery order volume changed year over year?
The two largest U.S. platforms report quarterly in SEC filings. In Q2 2026, DoorDash processed 970 million total orders, up 27% year over year (17% excluding its Deliveroo acquisition), on Marketplace GOV of $33.1 billion, up 36% (23% excluding Deliveroo). Uber’s Delivery Gross Bookings were $27.463 billion, up 26% (25% in constant currency) from $21.734 billion. Both figures include grocery and retail and span many countries. DoorDash only says growth in its U.S. restaurant category “accelerated slightly,” without a number, so do not present these as restaurant-only growth.
On the demand side, the honest answer is mixed: platform orders are growing double digits, while 43% of delivery customers told the NRA they ordered delivery less often in 2025 than a year earlier.
Third-party delivery commission rates in 2026
| Plan | Delivery commission | Pickup | Commission on a $40 delivery order |
|---|---|---|---|
| DoorDash Basic | 15% | 6% | $6.00 |
| DoorDash Plus | 25% | 6% | $10.00 |
| DoorDash Premier | 30% | 6% | $12.00 |
| Uber Eats Lite | 20% (15% in select cities) | 7% validated in-store pricing, 10% without | $8.00 |
| Uber Eats Plus | 25%, plus 5% on Uber One orders if you join | 7% or 10% | $10.00 ($12.00 on Uber One orders) |
| Uber Eats Premium | 30% | 7% or 10% | $12.00 |
| Uber Eats self-delivery | 15% | 7% or 10% | $6.00 |
Sources: DoorDash US merchant pricing (archived October 21, 2026) and Uber Eats US merchant pricing (fetched November 2026). Both say pricing may vary by market. For what each channel leaves you after fees and how to shift regulars to direct ordering, see our breakdown of restaurant marketing strategies ranked by what you keep.
Reservation statistics
Toast platform data for Q3 2025 versus Q3 2024 (Toast press release, November 18, 2025; vendor data from about 156,000 Toast locations):
- Seated reservations rose 8% on a same-store basis; cancellations rose 7%.
- About 2% of booked reservations were no-shows.
- Tuesday bookings grew fastest, up 15%; the 9 a.m. slot rose 19%.
- Solo-diner bookings rose 22% but were under 1% of all reservations.
- Average full-service tip: 19.2%; quick-service: 15.8%.
On the operator side, the NRA does not ask whether reservations are “important.” Its closest measures: 43% of full-service operators (versus 8% of limited-service) say technology significantly changed their reservations and inquiries in the past 2 to 3 years, and 85% of full-service operators say building on-premises business will be more important to their success in 2026.
On third-party share: we could not find a current, primary-sourced figure for what share of U.S. reservations go through OpenTable, Resy or similar platforms versus a restaurant’s own channels. Widely repeated percentages trace back to vendor surveys we could not re-verify, so we do not publish one.
Restaurant marketing and technology adoption
| Area where technology had a significant impact (past 2 to 3 years) | Full service | Limited service |
|---|---|---|
| Marketing and advertising | 56% | 64% |
| Customer feedback | 51% | 62% |
| Off-premises ordering and payment | 46% | 65% |
| Collection of customer data | 45% | 51% |
| Loyalty programs | 33% | 60% |
| Reservations and inquiries | 43% | 8% |
Source: NRA, 2026 State of the Restaurant Industry.
- 26% of operators use AI-related tools; marketing is the top AI use case (19% of full-service, 15% of limited-service operators).
- 72% of full-service and 78% of limited-service operators called attracting new customers a significant challenge in 2025; bringing back repeat customers was a significant challenge for 39% and 51%.
- 74% of consumers would order and pay with a smartphone app and 70% through a restaurant’s website; only 39% would order from an AI-generated persona on a video screen.
- 41% of consumers say technology improves hospitality, against 65% of operators.
Which number to cite
Most restaurant statistics pages mix projections, vendor surveys and platform data without saying which is which. Use this table to pick the right figure for the claim you are making.
| If you want to say | Cite | Not | Why |
|---|---|---|---|
| How big the restaurant industry is | NRA: $1.55T projected for 2026 | Census monthly figures annualized | NRA includes all foodservice; Census NAICS 722 covers restaurants and bars only |
| Whether restaurant sales are growing right now | Census: +7.0% YoY, September 2026 | The NRA forecast | Census is measured monthly; the forecast is from February |
| Whether growth is real or price-driven | NRA 1.3% real growth forecast, or Census minus CPI (about 3.4%, my calculation) | Nominal sales growth alone | Menu prices rose 3.5% in 12 months |
| Restaurant inflation | BLS food away from home: +3.5% | Headline CPI (+3.7%) | Headline CPI includes energy, housing and other categories |
| Loyalty programs influence diners | NRA 2026: 56% (full service) to 70% (delivery) | NRA 2025’s 61%, 54%, 41% | Newer survey; the 2025 release grouped diners differently, so the two sets are not a trend line |
| Delivery is growing | DoorDash or Uber YoY from SEC filings, with the “includes grocery and acquisitions” caveat | “Restaurant delivery grew X%” from platform totals | Platform totals are not restaurant-only |
| How diners find restaurants | Toast Oct 2025 survey: 38% word of mouth (label vendor) | The older “45% word of mouth” figure | We could not match 45% to the current Toast survey |
| Star-rating thresholds | BrightLocal 2026: 68% need 4+ stars | Undated “92% read reviews” style claims | BrightLocal publishes sample and date; it covers all local businesses |
| Commission costs | DoorDash and Uber Eats merchant pricing pages | “Apps take 30%” | Tiers run 15% to 30% for delivery and 6% to 10% for pickup |
How to cite these statistics
Name the publisher, the measurement date and the population. Copy-ready formats:
- Government data: “U.S. food services and drinking places sales were $92.9 billion in September 2026, up 7.0% from September 2025 (U.S. Census Bureau, Advance Monthly Retail Trade Survey, released October 15, 2026).”
- Association survey: “70% of U.S. delivery customers say loyalty program membership is important when choosing a restaurant (National Restaurant Association, 2026 State of the Restaurant Industry).”
- Vendor data: “38% of U.S. adults discover new restaurants through word of mouth, according to a Toast survey of 1,466 adults in October 2025.”
- Platform filing: “DoorDash’s total orders rose 27% year over year in Q2 2026, or 17% excluding its Deliveroo acquisition (DoorDash Q2 2026 results, August 5, 2026).”
When these numbers update
| Source | Frequency | Next expected |
|---|---|---|
| Census Advance Monthly Retail Trade (NAICS 722) | Monthly | October 2026 data on November 17, 2026 |
| BLS CPI, food away from home | Monthly | Mid-month, for the prior month |
| NRA State of the Restaurant Industry | Annual | The 2026 edition came out in February 2026 |
| DoorDash and Uber results | Quarterly | Q3 2026 results; DoorDash guided Q3 Marketplace GOV to $33.0B to $34.0B |
| BrightLocal Local Consumer Review Survey | Annual | The 2026 edition came out February 11, 2026 |
| Toast Restaurant Trends | Quarterly | Announced in Toast press releases; no fixed date |
Numbers we corrected or removed in this update
- “82% of diners plan to order delivery in 2025” was a misreading. The NRA’s February 2025 release says 82% would order delivery more often if their finances allowed (NRA, February 6, 2025).
- “45% of diners discover restaurants by word of mouth” was replaced with the 38% figure from Toast’s October 2025 survey.
- “65% of diners book reservations directly on the restaurant’s website” (a March 2024 vendor survey) was removed because we could not re-verify it.
- 2025 delivery platform figures were replaced with Q2 2026 SEC filings, and the 2025 loyalty figures with the NRA’s 2026 data.
For the NRA’s 2025 numbers specifically: the association projected $1.5 trillion in 2025 sales and 15.9 million jobs, and reported that 70% of operators with loyalty programs said the programs boosted traffic (NRA, February 2025). Its April 2025 Off-Premises report found nearly 75% of all restaurant traffic happens off-premises and nearly 9 in 10 consumers would use limited-time, app-only offers.
If you are deciding where a restaurant group’s marketing budget should go next quarter and want these numbers applied to your own sales mix, you can book a consultation.
Frequently asked questions
What are the most important restaurant marketing statistics for 2026?
Start with four: U.S. restaurant and bar sales were $92.9 billion in September 2026, up 7.0% year over year (Census); menu prices rose 3.5% (BLS); the National Restaurant Association projects $1.55 trillion in 2026 sales with 1.3% real growth; and 70% of delivery customers say loyalty membership matters when choosing a restaurant (NRA, February 2026).
How has restaurant delivery order volume changed year over year?
In Q2 2026 DoorDash total orders rose 27% year over year to 970 million, or 17% excluding its Deliveroo acquisition, and Uber Delivery Gross Bookings rose 26% to $27.5 billion. Both include grocery and retail. Consumer surveys are softer: 43% of delivery customers told the NRA they ordered less often in 2025 than a year earlier.
What percentage of restaurant customers say loyalty programs matter?
In the NRA's 2026 State of the Restaurant Industry, 70% of delivery customers, 65% of takeout customers, 64% of drive-thru customers, 63% of limited-service diners and 56% of full-service diners said loyalty program membership is important when choosing a restaurant. Gen Z and millennials rate it higher than baby boomers.
How much does DoorDash charge restaurants in 2026?
DoorDash's US merchant pricing lists three plans: Basic at 15% per delivery order, Plus at 25% and Premier at 30%, with pickup orders at 6% on every plan. Uber Eats charges 20% on Lite (15% in select cities), 25% on Plus and 30% on Premium, with pickup at 7% when in-store prices are validated.
What share of restaurant reservations are made through third-party platforms like OpenTable or Resy?
There is no current primary-sourced figure for the US split between third-party reservation platforms and restaurants' own channels. Percentages that circulate online come from vendor surveys that could not be re-verified. Toast platform data shows seated reservations rose 8% year over year in Q3 2025, with about 2% of bookings ending as no-shows.
What were the National Restaurant Association's key statistics for 2025?
The NRA projected $1.5 trillion in 2025 sales and 15.9 million jobs, and said 70% of operators with loyalty programs saw them boost traffic. Looking back in its 2026 report, the NRA found 42% of operators were not profitable in 2025 and more than 6 in 10 saw customer traffic decline versus 2024.
How do I cite restaurant statistics correctly?
Name the publisher, the period the number measures and the population. For example: food services and drinking places sales were $92.9 billion in September 2026, up 7.0% from a year earlier (U.S. Census Bureau, released October 15, 2026). Label vendor surveys as vendor research and note when platform figures include non-restaurant orders.
Business & economy data