

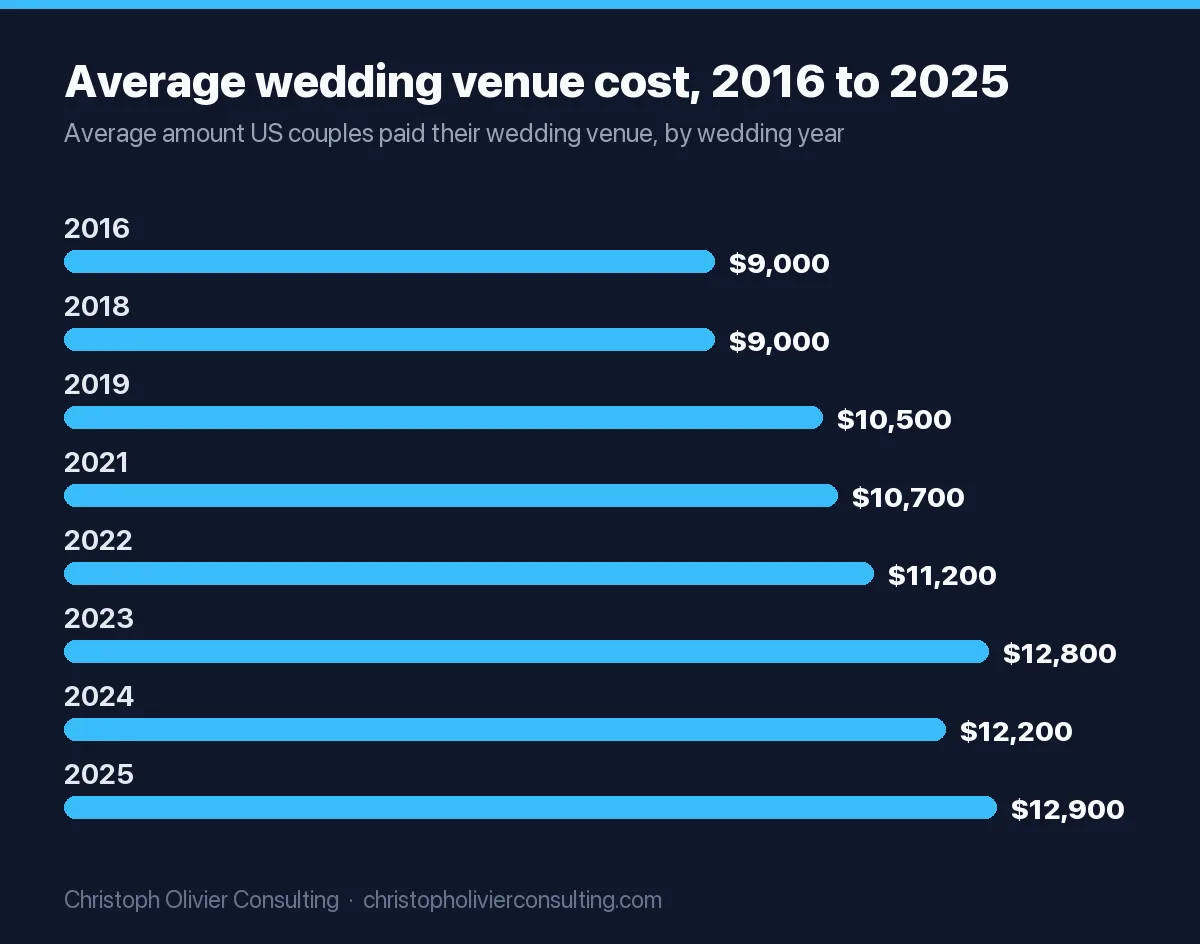
Most event venue owners earn somewhere between a loss and a low six-figure income, and the number depends far more on bookings per year than on the building. No government survey asks venue owners what they take home, so the honest answer has to be built from what is measured. Census data show that the median firm in the industry that includes banquet halls with catering staff takes in $100,000 to $499,999 a year, while the average is pulled up to about $1.07 million by a small group of large operators (Census Statistics of U.S. Businesses, 2022). Couples paid an average of $12,900 for a wedding venue in 2025 (The Knot Real Weddings Study 2026).
Short answer: A small, owner-run wedding venue doing 40 events a year at The Knot’s median-quartile venue spend of $10,400 brings in about $416,000. In my worked model that leaves roughly $79,000 of pre-tax profit, or about $150,000 if the owner also does the coordinator job instead of paying one. Below about 31 bookings a year the same venue loses money. Event coordinators employed by venues earn a median $59,290 (BLS, May 2025).
Below are the primary datasets that measure venue money, what each one actually counts, a revenue-by-size table from Census, the tax data behind realistic profit margins, a labeled P&L at 40, 80 and 120 events a year, the break-even math, and a pass/fail checklist to run before you buy or build a venue.
How much do event venue owners make? What each source measures
There is no single NAICS code for “event venue.” The 2022 NAICS index files “banquet halls with catering staff” under 722320 (Caterers), “banquet hall rental or leasing” and “reception hall rental or leasing” under 531120 (Lessors of Nonresidential Buildings), and arenas or concert halls that promote their own shows under 711310. Each code mixes venues with other businesses, so read the “what it measures” column before you compare yourself to any one number.
| Source and year | What it measures | Figure | Caveat |
|---|---|---|---|
| Census SUSB 2022, NAICS 722320 | Average receipts per firm, caterers including banquet halls with catering staff | $1,074,128 | $13.68 billion ÷ 12,733 firms (my calculation). Includes off-site caterers, not only venues |
| Census SUSB 2022, NAICS 722320 | Payroll as a share of receipts | 31.2% | $4.27 billion payroll ÷ $13.68 billion receipts (my calculation); excludes benefits and payroll taxes |
| Census SUSB 2022, NAICS 711310 | Average receipts per firm, promoters of events with their own facilities (arenas, concert halls, theaters) | $6,001,552 | $22.09 billion ÷ 3,681 firms (my calculation). Skewed by 73 firms with $100 million or more |
| Census SUSB 2022, NAICS 531120 | Lessors of nonresidential buildings, which includes banquet and reception hall rental | Not usable for venues | Dominated by office and retail landlords (31,260 firms, $144.5 billion receipts), so its average says nothing about a hall |
| The Knot Real Weddings Study 2026 | Average amount couples married in 2025 paid their wedding venue | $12,900 | 10,474 US couples surveyed. 41% said catering was included in the venue fee |
| BLS Occupational Outlook, May 2025 | Median wage, meeting, convention and event planners in accommodation and food services | $59,290 | Employees, not owners. All-industry median $61,160 |
| IRS SOI Table 1, tax year 2023 | Net income as a share of receipts, profitable sole proprietorships in accommodation and food services | 14.1% | $8.90 billion ÷ $63.23 billion (my calculation). No venue line exists in IRS tables |
Two gaps worth knowing. Census Nonemployer Statistics for 2022 only break out the broader “special food services” group (NAICS 7223) at the national level, so there is no public count of solo venue owners with no staff. And the IRS does not publish a separate line for banquet halls or event spaces in any of its business tables.
How much do event venues make in revenue?
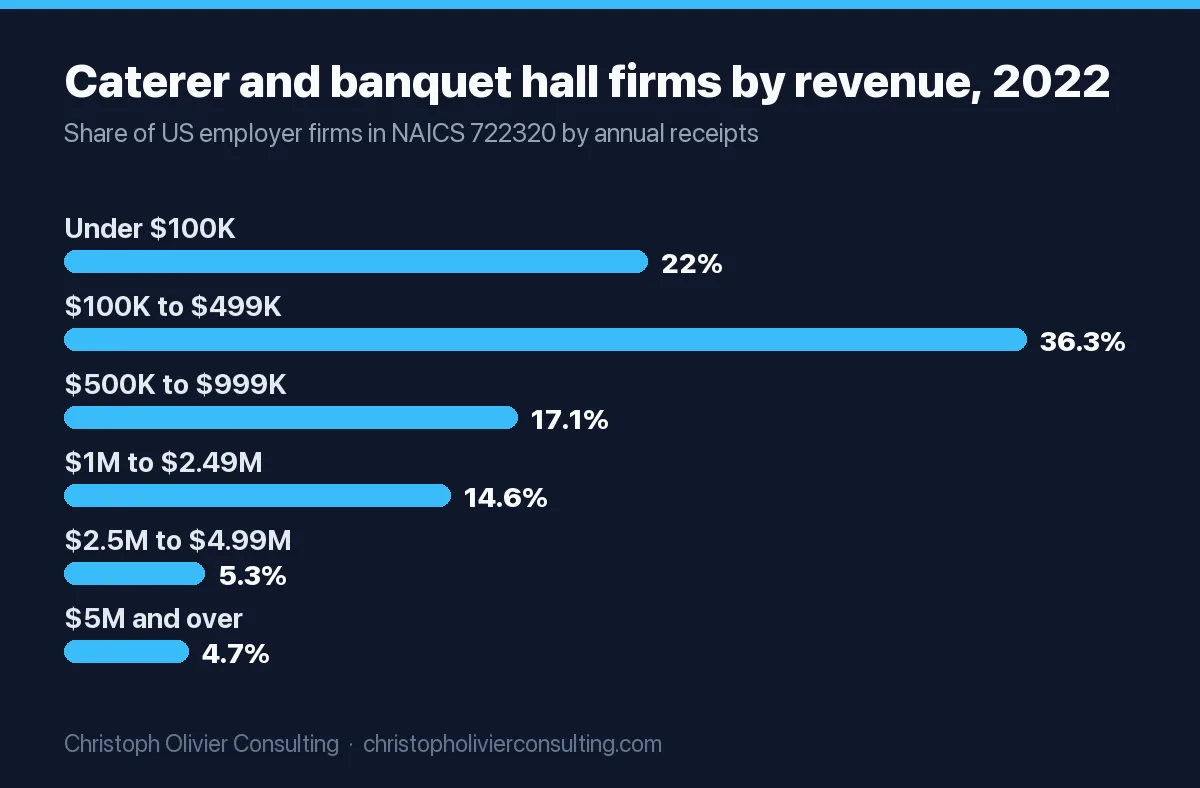
The closest measured proxy is NAICS 722320, because full-service banquet and wedding venues that run their own catering are classified there. In 2022 the industry had 12,733 employer firms, 13,046 locations and 136,136 employees, about 10 per location (Census SUSB). Most firms are small. The table and chart below show the full spread.
| Annual firm receipts (NAICS 722320, 2022) | Firms | Share of firms | Average receipts per firm in band |
|---|---|---|---|
| Under $100,000 | 2,806 | 22.0% | $41,519 |
| $100,000 to $499,999 | 4,619 | 36.3% | $266,338 |
| $500,000 to $999,999 | 2,179 | 17.1% | $708,153 |
| $1 million to $2.49 million | 1,853 | 14.6% | $1,510,722 |
| $2.5 million to $4.99 million | 672 | 5.3% | $3,311,415 |
| $5 million and over | 604 | 4.7% | Varies widely |
Source: Census SUSB 2022, employer firms only. Shares and averages are my calculations from published firm counts and receipts.
Read this as: 58.3% of firms take in less than $500,000, and only one in four clears $1 million. Payroll stays close to 30% of receipts in almost every size band (28.0% to 33.9% in the bands below $10 million), which tells you staffing scales with events, not with the building.
If your question is about concert venues rather than wedding or party venues, the 711310 data fit better: those 3,681 firms averaged $6.0 million, but the median firm sits in the $500,000 to $999,999 band and payroll runs a lower 22.2% of receipts (my calculations from the same Census file).
How much couples pay a wedding venue (your price ceiling)
Weddings are the anchor booking for most private venues. CDC data count 2,041,926 marriages in 2023 (provisional). The Knot’s 2026 study, covering couples married in 2025, gives the price points that set your revenue per event.
| Wedding venue spend (2025 weddings) | Average |
|---|---|
| National average venue cost | $12,900 |
| Couples in the lower cost quartile | $3,500 |
| Couples in the median cost quartile | $10,400 |
| Couples in the upper cost quartile | $24,800 |
| Weddings with 1 to 50 guests | $6,500 |
| Weddings with 51 to 100 guests | $10,400 |
| Weddings with 101 or more guests | $16,000 |
| Lowest state average (Wyoming) | $3,770 |
| Highest state average (New Jersey) | $27,710 |
| Catering, per person (separate line) | $80 |
| Average guest count | 117 |
Source: The Knot, average wedding venue cost and The Knot, average wedding cost, 2026 Real Weddings Study (10,474 couples married in 2025).
What is included matters for your revenue model. Of The Knot’s respondents, 74% said the reception venue included rentals, 41% said catering was included, 37% said alcohol was included, and only 7% said the fee covered the space alone. In other words, the $12,900 average is mostly paid to venues that bundle services, and a bare-room rental will usually sit below it.
Is $10,000 expensive for a wedding venue?
Not nationally. $10,000 is just under what median-quartile couples spent ($10,400) and below the $12,900 average. Where you are changes the answer: it would be a premium price in Wyoming ($3,770 average) or Idaho ($4,020), and a below-average one in New Jersey ($27,710) or New York ($21,300). For an owner, the useful reading is the reverse: your state average is roughly the ceiling for a typical booking unless you offer catering, lodging or an all-inclusive package.
Event venue profit margin: what the tax data shows
The margins quoted on most venue blogs (10% to 30%, “up to 60%”) are not tied to any dataset I could find. The IRS does publish actual profit and loss for unincorporated businesses, and two of its lines bracket the two venue models.
| IRS line, tax year 2023 (sole proprietorships) | Closest venue model | Net margin, all returns | Net margin, profitable returns only |
|---|---|---|---|
| Accommodation and food services | Full-service venue with catering and bar | 1.9% | 14.1% |
| Restaurants and drinking places | F&B-heavy venue | 3.4% | 13.6% |
| Lessors of real estate (incl. miniwarehouses and self storage) | Space-only rental hall | −5.1% (net loss) | 28.7% |
Source: IRS Statistics of Income, Table 1, Nonfarm Sole Proprietorships, tax year 2023. Margins are my calculation (net income ÷ business receipts). Many landlords report on Schedule E rather than Schedule C, so the lessor line is a partial picture.
The pattern: a rental-only hall has a higher margin when it is full, because there is no food cost, but it carries the same fixed building costs, so the whole group lost money in aggregate. A venue that sells food and drink brings in more dollars per event at a thinner margin. Profitable operators in both groups kept somewhere between about 14% and 29% of revenue before owner taxes.
Is a 40% profit margin high?
Yes, for a venue it is unusually high. Profitable lessors of real estate averaged 28.7% and profitable food and accommodation businesses 14.1% in the IRS data above. A 40% margin is only plausible for a paid-off property rented as space only, where the owner does the coordination unpaid and the margin is really owner wages plus profit combined. If a seller’s listing shows 40%, ask whether it includes a market salary for the owner and a real mortgage or rent payment.
What is the typical profit margin in event management?
Event planning firms are a different business: no building, mostly labor. Neither Census nor the IRS publishes a separate profit figure for them. The useful public number is the wage side: BLS reports a median of $61,160 for meeting, convention and event planners in May 2025, and 10% of planners were self-employed (BLS).
Event venue owner income at 40, 80 and 120 events a year (own calculation)
This is my model, not survey data. The prices come from The Knot, the salaries from BLS, and the payroll share is checked against the 31.2% Census ratio. Every other cost is a labeled assumption: replace it with your own quotes.
| Line (annual) | Small: 40 events, space plus rentals | Mid: 80 events, space plus rentals | Large: 120 events, in-house catering |
|---|---|---|---|
| Wedding venue fees | 40 × $10,400 = $416,000 | 50 × $12,900 = $645,000 | 70 × $12,900 = $903,000 |
| Catering on weddings (117 guests × $80) | None | None | 70 × $9,360 = $655,200 |
| Other events (corporate, social), assumed price | None | 30 × $4,000 = $120,000 | 50 × $5,000 = $250,000 |
| Revenue | $416,000 | $765,000 | $1,808,200 |
| Food and beverage cost (assumed 35% of catering) | $0 | $0 | $229,320 |
| Event-day hourly staff and cleaning (assumed per event) | $1,500 × 40 = $60,000 | $1,200 × 80 = $96,000 | $3,000 × 120 = $360,000 |
| Salaried staff at BLS medians, plus 20% assumed taxes and benefits | 1 coordinator: $71,148 | Coordinator + food service manager: $154,416 | 2 coordinators + food service manager: $225,564 |
| Occupancy: mortgage or rent, property tax, insurance (assumed) | $120,000 | $180,000 | $300,000 |
| Utilities, repairs, grounds (assumed) | $40,000 | $70,000 | $140,000 |
| Marketing and listing fees (assumed 5% of revenue) | $20,800 | $38,250 | $90,410 |
| Software, card fees, accounting, legal (assumed) | $25,000 | $45,000 | $90,000 |
| Pre-tax profit to owner | $79,052 (19.0%) | $181,334 (23.7%) | $372,906 (20.6%) |
| Payroll share of revenue (check vs Census 31.2%) | 31.5% | 32.7% | 32.4% |
Own calculation. Prices: The Knot 2026 Real Weddings Study (median-quartile venue spend $10,400, average $12,900, catering $80 per person, 117 guests). Salaries: BLS May 2025 medians for event planners in accommodation and food services ($59,290) and food service managers ($69,390). Occupancy is treated as a cash payment, so it includes loan principal; “profit” here means pre-tax cash available to the owner, before any owner salary.
Three things the model shows. First, the large venue has the most dollars but not the best margin, because catering adds $655,200 of revenue that carries food cost and kitchen labor. Second, the mid-size venue earns more than twice the small one on less than twice the revenue, because occupancy does not double when bookings do. Third, every margin lands inside the 14% to 29% range that profitable IRS filers in the comparable lines actually reported, which is a sanity check, not proof.
Owner pay = salary + profit
When people ask how much event venue owners make, they usually mean everything the owner takes out. That has two parts:
- Wage for the job you do. If you run tours, sell dates and work every Saturday, you are doing a coordinator’s job that BLS prices at a median $59,290 to $61,160. In the small model, an owner who does that job instead of hiring keeps the $71,148 coordinator line, so total owner earnings become $79,052 + $71,148 = $150,200 before tax (own calculation).
- Return on the property and the risk. What is left after a market wage is the real profit. In the small model that is $79,052 on a building that may have cost far more. If a passive investment in the same property would earn more, the venue is paying you a job, not a business return.
Owners structured as S corporations usually split this into a W-2 salary and distributions; sole proprietors and single-member LLCs report it all as Schedule C or Schedule E income. The economics are the same either way. The same split appears on our pages on coffee shop owner salary and gym owner salary, both businesses where a fixed space has to be filled.
Is owning an event venue profitable? The break-even math
It is profitable once fixed costs are covered, and the number of bookings that covers them is the single figure to know before you buy. Using the small model:
- Fixed costs per year: coordinator $71,148 + occupancy $120,000 + utilities and repairs $40,000 + admin $25,000 = $256,148.
- Contribution per booking: $10,400 fee − $1,500 event-day staff − $520 marketing (5%) = $8,380.
- Break-even: $256,148 ÷ $8,380 = 30.6 bookings a year.
- At 25 bookings the venue loses about $46,600. At 40 it makes $79,052. At 50 it makes about $162,850.
Each booking past break-even drops roughly $8,380 to the owner, which is why calendar fill matters more than almost anything else. Weekend dates in the May to October season sell first (The Knot notes prime wedding season runs May through October in most of the US), so the profit is made on Fridays, Sundays, weekdays and winter months. A practical marketing plan for those dates looks like a classic event marketing plan: corporate holiday parties, nonprofit galas and off-peak packages. Wedding referrals from planners also matter; our guide to wedding planner marketing shows how planners pick partners, which is the other side of that relationship.
Is a venue a good investment?
It can be, but it is two investments in one: real estate and an operating business. The real estate part can appreciate even when the business barely breaks even. The operating part depends on bookings you have to sell every year. Judge the two separately, and treat a seller’s “profit” figure with care if it does not include a market wage for whoever does the selling and the Saturday shifts.
Before you buy or build: pass/fail checklist
Run every test before you sign. Thresholds with a linked source come from that source; the 60% booking test, the one-quarter non-wedding test and the 20% and 40% payroll bounds are my own rules of thumb.
| Test | Pass | Fail |
|---|---|---|
| Break-even bookings (fixed costs ÷ contribution per booking) | Below 60% of the bookings you can realistically sell in year one | Break-even needs nearly every peak Saturday sold |
| Price vs your state’s average venue spend (The Knot) | Your planned fee is at or below the state average, or you bundle catering to justify more | Bare-space fee priced above the state average |
| Payroll share | Planned payroll near the 31% Census industry ratio | Below 20% (understaffed plan) or above 40% |
| Owner wage | Model includes a market wage for the owner’s job ($59,290 BLS median) before profit | “Profit” only exists because the owner works unpaid |
| Non-wedding demand | At least a quarter of planned events are corporate, social or weekday | 100% weddings, all on peak weekends |
| Financing | Debt term matches the asset; SBA 504 real estate loans offer 10-, 20- and 25-year terms up to a $5.5 million maximum | Short balloon loan on a building that needs years to fill its calendar |
| Margin claimed by the seller | 14% to 29%, inside the IRS range for profitable filers | 40% or more with no owner wage or debt in the numbers |
Copy-ready venue owner pay worksheet
Fill this in with your own quotes. It mirrors the model above, so you can compare line by line.
- Bookings per year by type: weddings ___, corporate ___, social ___.
- Average fee per booking type: $___ (check against your state’s average venue cost from The Knot).
- Catering and bar revenue per event, if in-house: guests ___ × $___ per person.
- Revenue = (bookings × fees) + catering and bar.
- Variable cost per event: event-day staff $___, cleaning $___, food and drink cost ___% of catering.
- Fixed costs per year: salaried staff at BLS medians plus taxes and benefits $___, occupancy $___, utilities and repairs $___, software and admin $___, marketing $___.
- Pre-tax profit = revenue − variable costs − fixed costs.
- Break-even bookings = fixed costs ÷ (average fee − variable cost per event).
- Owner pay = profit + any salaried role you fill yourself.
- Sanity checks: payroll near 31% of revenue; margin inside 14% to 29%.
In my view, if a venue’s numbers work on paper but the calendar does not, the fix is usually how dates are sold, not the building. Our profit margin by industry page shows how venues compare with other service businesses, and you can book a consultation if you want a second pair of eyes on a booking plan.
How these figures were compiled
- Census SUSB 2022, U.S. 6-digit NAICS by enterprise receipts size, released April 10, 2025. Averages, shares and payroll ratios are my calculations from published firm counts, payroll and receipts.
- NAICS classification from the 2022 NAICS index file: banquet halls with catering staff (722320), banquet and reception hall rental (531120).
- IRS SOI Table 1, nonfarm sole proprietorships, tax year 2023. Margins are my calculations. Partnerships and corporations are not included.
- The Knot 2026 Real Weddings Study, 10,474 US couples married between January 1 and December 31, 2025, as published on The Knot’s venue and wedding cost pages.
- BLS Occupational Outlook Handbook, wages for May 2025.
- The worked P&L is my own model. Per-event staff costs, occupancy, utilities, admin, a 35% food cost, a 5% marketing budget and a 20% benefits load are assumptions, not measured market data.
Ready to scale your revenue?
Book a free 30-min consultation. We’ll diagnose your growth bottleneck and map out the 3 highest-leverage moves for your business.
Frequently asked questions
How much do event venue owners make?
No government survey reports venue owner pay directly. In a worked model using The Knot and BLS figures, a small venue doing 40 weddings a year at $10,400 clears about $79,000 before tax, or about $150,000 if the owner also does the coordinator job. A mid-size venue doing 80 events clears about $181,000. Below roughly 31 bookings the small venue loses money.
How much do event venues make a year?
Census Statistics of U.S. Businesses data for 2022 show caterers, the industry that includes banquet halls with catering staff, averaged $1.07 million in receipts per firm. The typical firm is far smaller: 58.3% took in under $500,000 and the median firm falls in the $100,000 to $499,999 band. Only about one in four firms passed $1 million.
What is a typical event venue profit margin?
IRS tax year 2023 data for profitable sole proprietorships show net margins of 14.1% in accommodation and food services and 28.7% for lessors of real estate. A venue with in-house catering tends to sit near the lower figure, a space-only rental hall nearer the higher one. Across all filers, including loss makers, both groups were far lower.
Is owning an event venue profitable?
It is once bookings cover fixed costs. In a worked small-venue model, fixed costs of $256,148 a year and about $8,380 kept per booking put break-even at roughly 31 bookings. At 25 bookings the venue loses about $46,600; at 40 it makes about $79,000. Calendar fill, especially off-peak dates, decides profitability.
Is $10,000 expensive for a wedding venue?
Not nationally. The Knot 2026 Real Weddings Study puts the average venue cost at $12,900 for 2025 weddings, and median-quartile couples spent $10,400. State averages range from $3,770 in Wyoming to $27,710 in New Jersey, so $10,000 is premium in some states and below average in others.
Is a 40% profit margin high for a venue?
Yes. Profitable IRS sole proprietorships kept 28.7% as lessors of real estate and 14.1% in accommodation and food services in tax year 2023. A 40% margin usually means the figure leaves out a market wage for the owner, a mortgage or rent payment, or both. Ask for those lines before trusting it.
Practice economics benchmarks