
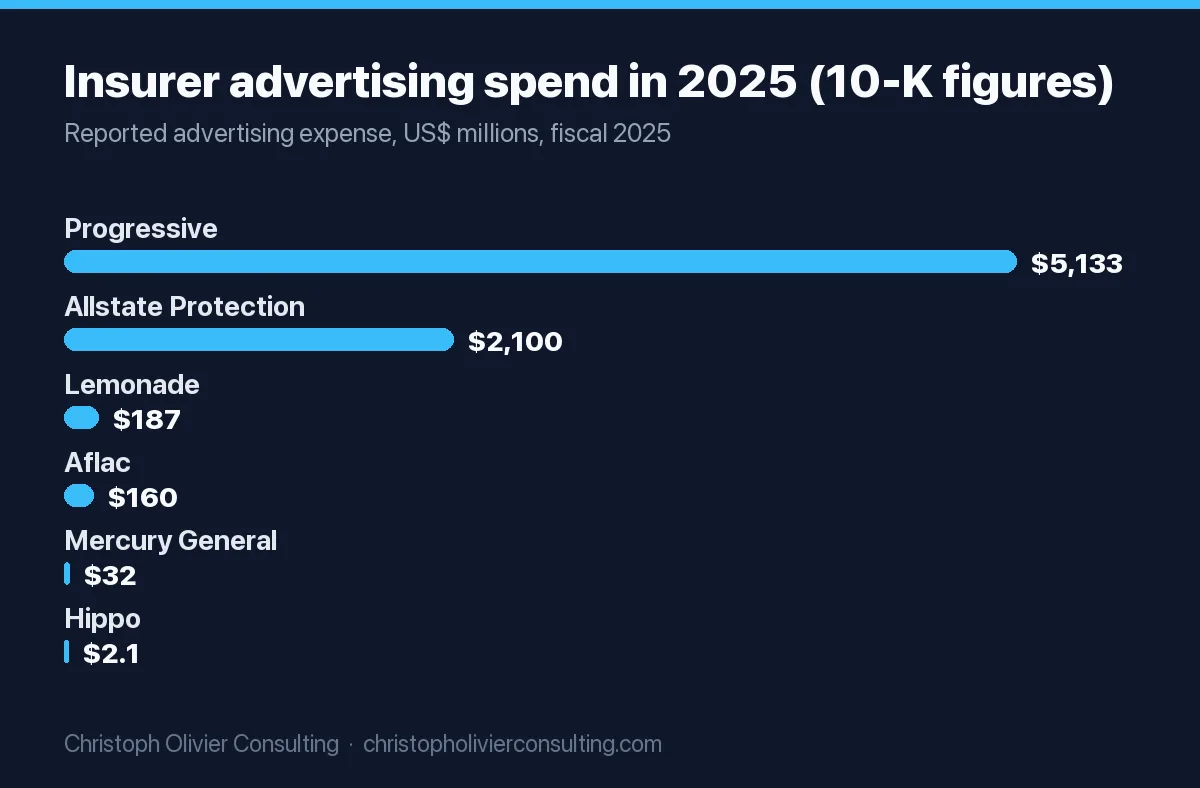
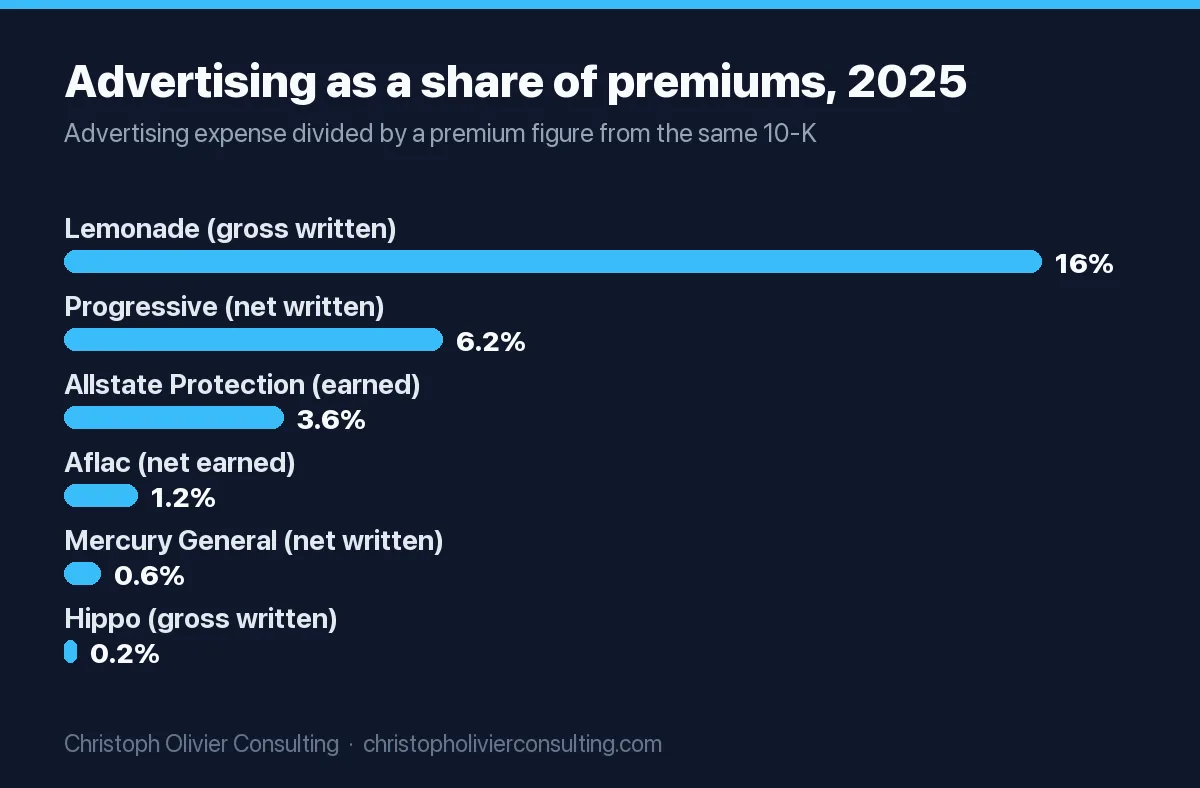
The biggest US insurance companies spend between a few million and more than $5 billion a year on advertising. Progressive reported $5.133 billion of advertising costs for 2025 in its 10-K, and Allstate reported $2.1 billion for its Allstate Protection segment. GEICO and State Farm do not break out an advertising line in their own annual reports. Measured against premiums, the large carriers in our table spend roughly 0.2% to 6% of premiums on advertising, and a growth-stage insurtech like Lemonade spends about 16%. Those percentages are our own calculations from each company’s filing.
Every company figure below comes from the company’s own annual filing (the FY2025 10-K on sec.gov, or the annual report on its own site), with the line item quoted and the year stated. Where a company does not disclose the number, the table says so instead of guessing.
Short answer: In 2025, Progressive spent $5.133 billion on advertising, Allstate Protection $2.1 billion, Aflac $160 million, Lemonade $187.3 million and Mercury General $32.0 million, per their 10-Ks. That is about 6.2% of net premiums written at Progressive and 3.6% of premiums earned at Allstate Protection. GEICO’s and State Farm’s advertising budgets are not disclosed in their own reports.
Insurance company advertising spend by company: 2023 to 2025
This is the core data table. Each row quotes the line item the company itself uses, because “advertising costs,” “advertising expense” and “sales and marketing” are not the same thing. Amounts are in US dollars and come from the FY2025 10-K, which also restates 2024 and 2023.
| Company | Line item as reported | 2023 | 2024 | 2025 | Source |
|---|---|---|---|---|---|
| Progressive | “Total advertising costs, which are expensed as incurred” (companywide) | $1.600B | $4.003B | $5.133B | Progressive FY2025 10-K |
| Allstate | “Advertising expense,” Allstate Protection segment | $638M | $1.863B | $2.100B | Allstate FY2025 10-K |
| GEICO (Berkshire Hathaway) | No advertising line. Only total “underwriting expenses” | Not disclosed | Not disclosed | Not disclosed | Berkshire FY2025 10-K |
| State Farm Mutual | No advertising line. Only “Service and Administrative Fees” | Not disclosed | Not disclosed | Not disclosed | State Farm 2025 Annual Report |
| Travelers | No advertising line in the 10-K | Not disclosed | Not disclosed | Not disclosed | Travelers FY2025 10-K |
| Aflac | “Advertising expense” (consolidated, US and Japan) | $188M | $181M | $160M | Aflac FY2025 10-K |
| Lemonade | “Advertising expenses totaled” | $55.2M | $121.5M | $187.3M | Lemonade FY2025 10-K |
| Mercury General | “Net advertising expense” (after agent reimbursements) | $8.9M | $20.8M | $32.0M | Mercury General FY2025 10-K |
| Root | No separate advertising line. “Sales and marketing” (includes performance marketing, advertising, referral fees, staff) | $49.3M S&M | $135.8M S&M | $174.8M S&M | Root FY2025 10-K |
| Hippo | “Advertising costs were” | $10.2M | $3.3M | $2.1M | Hippo FY2025 10-K |
Two things jump out. First, the swing: Progressive’s advertising more than tripled from 2023 to 2025, and Allstate’s tripled from 2023 to 2024. Second, the gaps: two of the four best-known auto insurance brands in America do not publish what they spend on ads in their own reports.
Advertising as a share of premiums (our calculation)
Dollar totals mostly tell you who is biggest. The ratio of advertising to premiums tells you how hard each company is pushing for growth. We divided each company’s reported advertising figure by a premium figure from the same 10-K. The denominators differ by company (written vs earned, gross vs net), so treat small differences as noise.
| Company (2025) | Advertising | Premium base used | Ad-to-premium ratio | 2024 ratio | 2023 ratio |
|---|---|---|---|---|---|
| Progressive | $5.133B | Net premiums written $83.174B | 6.2% (our calc) | 5.4% | 2.6% |
| Allstate Protection | $2.100B | Premiums earned $57.682B | 3.6% (reported by Allstate) | 3.5% | 1.3% |
| Lemonade | $187.3M | Gross written premium $1.1713B | 16.0% (our calc) | 13.1% | 7.5% |
| Root | $174.8M (sales and marketing, not ads alone) | Gross premiums written $1.5058B | 11.6% (our calc, S&M basis) | 10.4% | 6.3% |
| Aflac | $160M | Net earned premiums $13.548B | 1.2% (our calc) | 1.3% | 1.3% |
| Mercury General | $32.0M | Net premiums written $5.722B | 0.6% (our calc) | 0.4% | 0.2% |
| Hippo | $2.1M | Gross written premium $1.1086B | 0.2% (our calc) | 0.4% | 1.2% |
The pattern is about distribution, not size. Progressive and Lemonade sell heavily direct to consumers, so advertising does the job an agent would otherwise do. Mercury sells through independent agents and says its commissions “were approximately 15% of net premiums written” in 2025, so its own ad budget is a rounding error by comparison, and part of it is reimbursed by agents “based upon the number of account leads generated by the advertising” (Mercury 10-K). Hippo, which says it paused new HO3 homeowners business nationwide after severe-weather losses in the second quarter of 2023, cut advertising to almost nothing.
Progressive advertising budget: $5.1 billion in 2025
Progressive is the clearest answer to “how much do insurance companies spend on marketing,” because it publishes the number every year. Its FY2025 annual report says: “For 2025, our total companywide advertising costs were $5.1 billion, compared to $4.0 billion in 2024… and exceeded the amount of advertising spend for any previous annual period” (Progressive FY2025 10-K). The exact note figures are $5,133 million (2025), $4,003 million (2024) and $1,600 million (2023).
The filing also states the rule Progressive uses to set the budget. It will “continue to advertise to maximize growth, as long as we remain on track to achieve our profitability goal and can acquire customers at or below our target acquisition cost.” In other words, the budget is not a fixed percentage. It flexes with profitability and with the cost of acquiring each policy.
What did the money buy? Progressive reports that in 2025 it “experienced an increase in direct personal auto quote volume of 5% with a rate of conversion increase of 6%, compared to 2024, primarily driven by the increased advertising spend.” Net premiums written grew 12% to $83.174 billion and personal lines policies in force grew 11% to 37.4 million.
For scale: in the SEC’s XBRL dataset of companies that tag an advertising expense figure for calendar 2025, Progressive’s $5.133 billion ranks 7th of 1,464 filers (SEC XBRL frames, AdvertisingExpense CY2025). That puts it ahead of Expedia, Verizon, T-Mobile and PepsiCo.
How much does GEICO spend on marketing?
GEICO’s advertising budget is not disclosed in Berkshire Hathaway’s 10-K or annual report. Berkshire reports GEICO’s total underwriting expenses and says what drove the change, but it does not break out advertising. Here is what the FY2025 10-K does say (Berkshire FY2025 10-K):
- GEICO underwriting expenses were $5.513 billion in 2025, $4.108 billion in 2024 and $3.815 billion in 2023, on premiums written of $45.193 billion, $42.916 billion and $39.837 billion.
- GEICO’s expense ratio was 12.4% in 2025, up 2.7 points, and “the increases were driven by higher advertising and other policy acquisition expenses.”
- For 2024, the expense ratio held at 9.7% because efficiency gains “were offset by increased advertising expenses.”
So the direction is public (up in 2024, up again in 2025), but the dollar figure is not. The figures you see quoted for GEICO come from analysts who add up the advertising line in the statutory statements GEICO’s insurance companies file with state regulators. Those are third-party compilations, not GEICO’s own disclosure. For example, Repairer Driven News reported that a Dowling & Partners study put GEICO at $2.07 billion of advertising in 2021, “about one-fifth of the industry total,” and Insurance Business reported that S&P Global Market Intelligence put GEICO at $1.28 billion in 2022, a 38% cut.
State Farm advertising spend
State Farm is a mutual company owned by its policyholders and does not file a 10-K. Its 2025 Annual Report for State Farm Mutual Automobile Insurance Company is a two-page summary: premium earned of $73.017 billion, $51.394 billion for claims, $6.175 billion of expenses for paying claims, and $13.901 billion of “Service and Administrative Fees.” There is no advertising line, so State Farm’s advertising spend is not disclosed in its own report.
Third-party statutory compilations give a range for earlier years. Insurance Business, citing S&P Global, reported State Farm and affiliates at about $1.01 billion in 2022, $1.07 billion in 2021 and a five-year peak of $1.21 billion in 2019. The Dowling study cited by Repairer Driven News adds a caveat that matters: State Farm managers and agents received “some $1.4 billion to spend on advertising” in 2021 on top of the $1.1 billion recorded at the company level. Agent-funded local advertising does not show up in the carrier’s own advertising line.
Allstate, Aflac and the insurtechs
Allstate
Allstate reports advertising for its Allstate Protection segment (auto, homeowners and other personal lines) in a table titled “Impact of specific costs and expenses on the expense ratio”: $638 million in 2023, $1.863 billion in 2024 and $2.100 billion in 2025. Allstate itself converts these to 1.3, 3.5 and 3.6 points of the expense ratio, and says the 2025 expense ratio improvement was “partially offset by an increase in advertising costs” (Allstate FY2025 10-K). The figure covers the Protection segment only, not Allstate’s other businesses.
Aflac
Aflac, known for its duck campaign, says “advertising expense was $160 million, $181 million and $188 million” for 2025, 2024 and 2023 (Aflac FY2025 10-K). That is about 1.2% of its $13.548 billion of net earned premiums (our calculation), and it covers both Aflac Japan and Aflac US.
Lemonade, Root and Hippo
The three listed insurtechs show three different strategies in one year:
- Lemonade is spending into growth. Advertising rose to $187.3 million, and the 10-K says brand and performance advertising “increased by $65.8 million, or 54%, as a result of increased spending on search advertising and other customer acquisition channels.” Lemonade also finances up to 80% of its “growth spend” through an agreement with GC Customer Value Arranger, a General Catalyst company, repaid with a 16% rate of return (Lemonade 10-K).
- Root does not disclose advertising on its own. Its sales and marketing line rose to $174.8 million, driven by “a $26.9 million increase in direct performance marketing spend” and “a $9.5 million increase in experimental marketing spend” (Root 10-K).
- Hippo nearly stopped advertising: $10.2 million in 2023, $3.3 million in 2024, $2.1 million in 2025 (Hippo 10-K).
How much money do insurance companies spend on advertising in total?
No single public filing gives a current industry total. SEC data only covers listed companies that choose to tag the figure, and mutual insurers such as State Farm do not file 10-Ks at all; their detailed numbers sit in statutory statements filed with state regulators. The most recent industry totals we could verify are third-party compilations of those statutory statements:
- Dowling & Partners put 2021 auto insurer advertising at a level where GEICO’s $2.07 billion was “about one-fifth of the industry total,” and found the top 20 advertisers made up 93% of spending (Repairer Driven News, whose headline sums it as $10 billion).
- AM Best data reported by Carrier Management found the five largest property/casualty advertisers “accounted for nearly 65 percent of all industry advertising in 2022.”
Since then, the four carriers above that do disclose (Progressive, Allstate Protection, Lemonade, Mercury) went from about $2.3 billion combined in 2023 to about $7.5 billion in 2025 (our sum of the 10-K figures). The direction of the industry since 2023 is clearly up. The exact total is not public.
Why insurers advertise this much, and why it swings
Most insurance advertising dollars go to personal auto, which AM Best data in Carrier Management describes as “highly competitive and compulsory.” That makes advertising a volume lever. A Dowling & Partners study described advertising as “a key non-rate ‘tool’ to turn on/off the growth spigot for direct writers during periods of price correction” (Repairer Driven News). The filings show that lever being pulled in real time: when private passenger auto results deteriorated, Allstate Protection advertising fell to $638 million in 2023 and Progressive’s to $1.6 billion. As profitability recovered, both roughly tripled by 2025.
There is also evidence that repetition pays even for famous brands. A Stanford Graduate School of Business randomized experiment with more than 325,000 web visitors found that one banner ad for an auto insurer raised the chance of visiting its website from 0.2% to 0.8% that day, and competitors saw an 11% drop in visits the following day (Stanford Report, January 2026). The researchers’ conclusion is that ads push rival brands out of memory, which “creates an incentive to advertise more.”
What industry spends the most on marketing?
By total advertising dollars reported to the SEC, the top spenders are retail and e-commerce, consumer packaged goods, media and telecom. Insurance has exactly one company in the top 30: Progressive. Here are the ten largest CY2025 advertising expense figures in the SEC XBRL dataset (SEC frames API):
| Rank | Company | Advertising expense, fiscal year in CY2025 | Industry |
|---|---|---|---|
| 1 | Amazon | $23.5B | Retail, e-commerce |
| 2 | PDD Holdings | $10.7B | E-commerce |
| 3 | Procter & Gamble | $9.2B | Consumer goods |
| 4 | Walt Disney | $6.5B | Media |
| 5 | Coca-Cola | $5.4B | Beverages |
| 6 | Walmart | $5.4B | Retail |
| 7 | Progressive | $5.133B | Insurance |
| 8 | Expedia Group | $3.9B | Travel |
| 9 | Verizon | $3.832B | Telecom |
| 10 | T-Mobile US | $3.7B | Telecom |
The list only includes companies that tag the standard advertising element, so some large advertisers that report the number differently are missing. Allstate, for example, reports $2.1 billion but does not tag it this way. For the ratio view (advertising as a share of sales by industry, using SEC and IRS data), see our advertising to sales ratio by industry breakdown, and for how consumer brands like Nike and Coca-Cola compare, see big brand marketing budgets.
What is the 80/20 rule for insurance companies?
The 80/20 rule is a health insurance rule, not an auto or home insurance one. Under the Affordable Care Act’s medical loss ratio (MLR) requirement, health insurers must spend at least 80% of premium revenue on health care costs and quality improvement. “The other 20% can go to administrative, overhead, and marketing costs” (HealthCare.gov). Insurers selling to large groups, usually more than 50 employees, must spend at least 85%. If an insurer misses the target, it owes policyholders a rebate (CMS).
So for a health insurer, marketing has a hard ceiling: it shares the 15% or 20% bucket with every other overhead cost. Property and casualty insurers like Progressive and GEICO have no equivalent federal cap. Their limit is the profitability target, which is why their advertising budgets move so much from year to year.
Ad-to-premium ratio calculator for an insurance agency
Carrier budgets are not a target for an agency, because the carrier keeps the whole premium and you keep a commission. The useful translation is to measure your own spend against the premium and commission it produces. Copy these formulas into a spreadsheet:
- Ad-to-premium ratio = monthly ad spend ÷ new annual premium written that month.
- Ad-to-commission ratio = monthly ad spend ÷ (new annual premium × your new-business commission rate).
- Cost per policy = monthly ad spend ÷ new policies written.
- Payback in months = cost per policy ÷ (average annual premium × commission rate ÷ 12).
- Expected policy years = 1 ÷ (1 minus annual retention rate).
Worked example with hypothetical inputs (replace them with your own production report). The 15% commission rate is borrowed from Mercury’s disclosed average agent commission, as one public reference point; your carrier contracts will differ.
| Input or output | Value | Math |
|---|---|---|
| Monthly ad spend (search, social, mailers) | $5,000 | Input |
| New policies written from those ads | 40 | Input |
| Average annual premium per policy | $1,800 | Input |
| Commission rate | 15% | Input |
| Annual retention | 85% | Input |
| New annual premium written | $72,000 | 40 × $1,800 |
| Ad-to-premium ratio | 6.9% | $5,000 ÷ $72,000 |
| First-year commission | $10,800 | $72,000 × 15% |
| Ad-to-commission ratio | 46% | $5,000 ÷ $10,800 |
| Cost per policy | $125 | $5,000 ÷ 40 |
| Payback | 5.6 months | $125 ÷ ($1,800 × 15% ÷ 12 = $22.50) |
| Expected policy years | 6.7 | 1 ÷ (1 minus 0.85) |
| Lifetime commission per policy (flat rate, no growth) | $1,800 | $270 × 6.67 |
| Lifetime commission to cost per policy | 14.4 to 1 | $1,800 ÷ $125 |
Read it like this. A 6.9% ad-to-premium ratio looks close to Progressive’s 6.2%, but your 46% ad-to-commission ratio is the number that pays the bills: almost half of first-year commission goes to ads, recovered in under six months, and the policy keeps paying if it renews. If your renewal commission is lower than new-business commission, use the renewal rate for years two onward and the lifetime figure drops. Pass or fail rule: if payback runs past 12 months, or lifetime commission is less than 3 times cost per policy, cut the channel or fix conversion before adding budget. The 3 to 1 line is a common rule of thumb, explained in our LTV to CAC ratio guide; the inputs above are what our customer acquisition cost guide walks through in detail.
For actual channel prices an agency pays (lead vendors, Google Ads, CRM), see insurance agency marketing costs and budget. If you want these numbers built from your own book of business, you can book a consultation.
How to read insurer marketing numbers without getting misled
- Advertising is not total marketing. The 10-K advertising line usually excludes marketing staff, agent commissions and lead fees. Agent commissions are often the bigger acquisition cost: Mercury’s run about 15% of net premiums written against 0.6% for advertising.
- GAAP and statutory figures differ. The 10-K numbers here are GAAP, at the holding company level. Trade press figures for GEICO and State Farm come from statutory filings by insurance subsidiaries, so they do not match 10-K numbers exactly. Progressive’s own GAAP total is the companywide figure.
- Segment vs company. Allstate’s $2.1 billion is the Allstate Protection segment only. Aflac’s $160 million is consolidated across Japan and the US.
- Agent-funded ads are invisible. State Farm agent advertising and Mercury’s agent reimbursements show that local spend can sit outside the carrier’s line.
- Not disclosed means not disclosed. Any page giving you a precise current GEICO or State Farm advertising figure is quoting a third-party estimate, not the company.
Ready to scale your revenue?
Book a free 30-min consultation. We’ll diagnose your growth bottleneck and map out the 3 highest-leverage moves for your business.
Frequently asked questions
How much does Progressive spend on advertising?
Progressive reported total companywide advertising costs of $5.133 billion for 2025, $4.003 billion for 2024 and $1.600 billion for 2023 in its FY2025 10-K. The 2025 figure was the highest in the company's history and equals about 6.2% of its $83.174 billion of net premiums written, by our calculation. Progressive says it advertises as long as it meets its profitability goal and target acquisition cost.
How much does GEICO spend on advertising each year?
GEICO's advertising spend is not disclosed in Berkshire Hathaway's 10-K. Berkshire reports only GEICO's total underwriting expenses, $5.513 billion in 2025, and says the rise was driven by higher advertising and other policy acquisition expenses. Figures quoted elsewhere come from third-party compilations of statutory filings, such as S&P Global's estimate of $1.28 billion for 2022.
How much does State Farm spend on advertising?
State Farm does not disclose advertising in its own annual report, which shows only premium earned, claims, claim expenses and service and administrative fees. Third-party analyses of statutory filings put State Farm and affiliates at about $1.01 billion in 2022 and $1.07 billion in 2021. A Dowling and Partners study noted agents received another $1.4 billion for advertising in 2021.
What percentage of premiums do insurance companies spend on advertising?
Among insurers that disclose it, the 2025 range was wide. By our calculations from their 10-Ks, Progressive spent about 6.2% of net premiums written, Lemonade about 16% of gross written premium, Aflac 1.2% and Mercury General 0.6%. Allstate itself reports advertising at 3.6 points of its Allstate Protection expense ratio. Direct-to-consumer insurers spend the most relative to premiums.
What is the 80/20 rule for insurance companies?
It is the Affordable Care Act's medical loss ratio rule for health insurers. They must spend at least 80% of premium revenue on medical care and quality improvement, leaving at most 20% for administration, overhead and marketing. Large group plans must hit 85%. Insurers that fall short pay rebates. It does not apply to auto or home insurers.
Which insurance company spends the most on advertising?
Among companies that publish the figure, Progressive is the largest, with $5.133 billion in 2025. It ranks 7th of 1,464 companies in the SEC's CY2025 advertising expense dataset, ahead of Verizon and PepsiCo. GEICO and State Farm do not disclose current figures in their own reports, so a full ranking that includes them relies on third-party estimates.
How much should an insurance agency spend on advertising?
Work it back from commission rather than copying carrier ratios. Divide monthly ad spend by new premium written and by the commission it earns. In our hypothetical example, $5,000 a month producing 40 policies at $1,800 premium and 15% commission costs $125 per policy and pays back in about 5.6 months. Cut channels that take longer than 12 months.
Marketing budget research