

Apple does not publish an advertising budget. The last figure it disclosed was $1.8 billion of advertising expense in fiscal 2015. What Apple does publish, since its fiscal 2024 10-K, is a selling and marketing line: $21,134 million in fiscal 2026 (the year ended September 26, 2026), up from $19,524 million in fiscal 2025. That is about 4.4% of Apple’s $478,834 million in net sales. Everything on this page comes from Apple’s own Form 10-K filings on SEC EDGAR, read in November 2026, and every ratio that Apple did not state is labeled as my calculation.
Short answer: Apple’s selling and marketing expense was $21.1 billion in fiscal 2026 and $19.5 billion in fiscal 2025, per its 10-K segment note. That line covers sales and marketing costs, not only ads. Apple’s pure advertising expense has not been disclosed since fiscal 2015, when it was $1.8 billion (0.8% of net sales). Any current “Apple ad budget” number you see online is a third-party estimate.
Apple marketing budget at a glance (fiscal 2008 to 2026)
Apple reports two different things in different eras. From fiscal 2008 to 2015 it stated advertising expense in its accounting-policy note. From fiscal 2016 it kept the policy sentence and dropped the number. In fiscal 2024 a new segment disclosure rule led Apple to split selling, general and administrative expense (SG&A) into “selling and marketing” and “general and administrative” for each region. The table below puts every available figure in one place.
| Fiscal year | What Apple disclosed | Amount | Net sales | % of net sales (my calc.) | Filing |
|---|---|---|---|---|---|
| FY2026 | Selling and marketing (segment note) | $21,134M | $478,834M | 4.41% | 10-K, FY2026 |
| FY2025 | Selling and marketing (segment note) | $19,524M | $416,161M | 4.69% | 10-K, FY2025 |
| FY2024 | Selling and marketing (segment note) | $18,639M | $391,035M | 4.77% | 10-K, FY2025 and FY2026 |
| FY2023 | Selling and marketing (segment note) | $18,260M | $383,285M | 4.76% | 10-K, FY2025 |
| FY2016 to FY2022 | No advertising or marketing figure; SG&A only | Not disclosed | n/a | n/a | 10-K, FY2016 onward |
| FY2015 | Advertising expense | $1,800M | $233,715M | 0.77% | 10-K, FY2015 |
| FY2014 | Advertising expense | $1,200M | $182,795M | 0.66% | 10-K, FY2015 |
| FY2013 | Advertising expense | $1,100M | $170,910M | 0.64% | 10-K, FY2015 |
| FY2012 | Advertising expense | $1,000M | $156,508M | 0.64% | SEC XBRL data |
| FY2011 | Advertising expense | $933M | $108,249M | 0.86% | SEC XBRL data |
| FY2010 | Advertising expense | $691M | $65,225M | 1.06% | SEC XBRL data |
| FY2009 | Advertising expense | $501M | $42,905M | 1.17% | SEC XBRL data |
| FY2008 | Advertising expense | $486M | $37,491M | 1.30% | SEC XBRL data |
Net sales and older advertising amounts come from Apple’s XBRL financial data on SEC EDGAR, which is the machine-readable version of the same 10-K filings. Do not add the two halves of this table together or compare them as a trend: selling and marketing is a far wider bucket than advertising.
Selling and marketing: $21.1 billion in fiscal 2026
The fiscal 2026 10-K, Note 14 “Segment Information and Geographic Data”, lists selling and marketing for each of Apple’s five reportable regions. The note says Apple’s CEO, as chief operating decision maker, uses segment results to “decide how to allocate resources related to sales activities and marketing investments.” In other words, this is the closest thing to a marketing budget Apple has ever put in a filing, and it is set region by region.
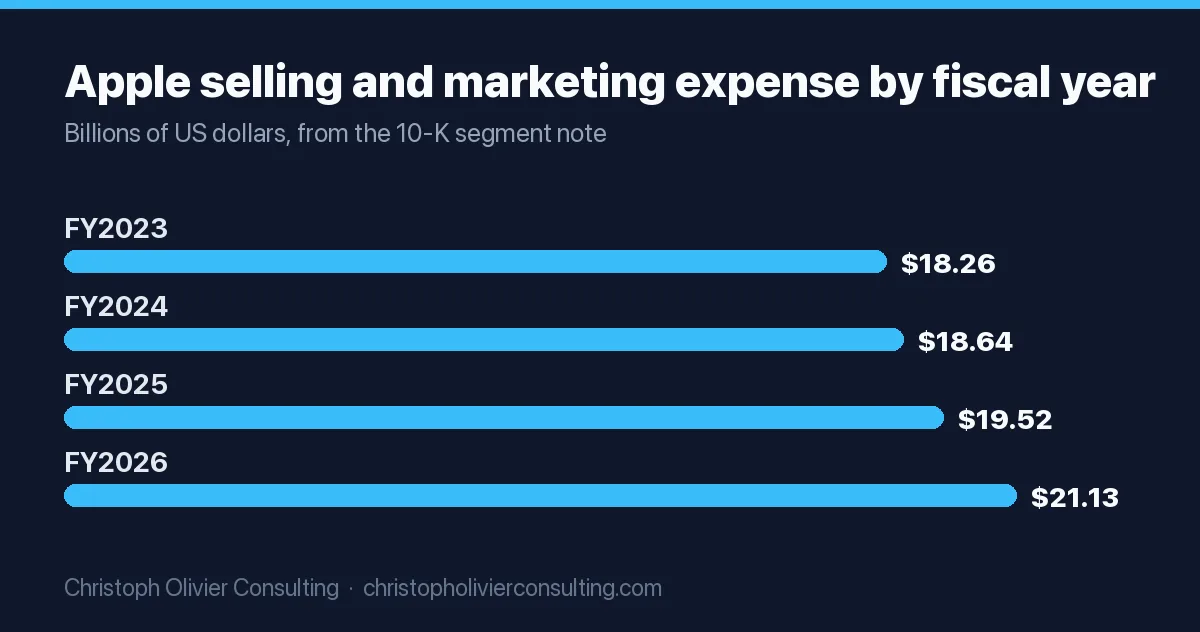
The table below is my own build from the segment tables in the fiscal 2026 10-K and the fiscal 2025 10-K. No site in the current search results shows Apple’s marketing spend by region or as a share of each region’s sales.
| Region (Apple segment) | S&M FY2023 | S&M FY2024 | S&M FY2025 | S&M FY2026 | FY2026 net sales | S&M as % of region sales, FY2026 (my calc.) |
|---|---|---|---|---|---|---|
| Americas | $9,658M | $9,802M | $10,174M | $10,754M | $198,083M | 5.43% |
| Europe (incl. India, Middle East, Africa) | $4,095M | $4,341M | $4,676M | $5,119M | $127,604M | 4.01% |
| Greater China | $2,444M | $2,351M | $2,319M | $2,690M | $82,378M | 3.27% |
| Japan | $827M | $854M | $969M | $1,055M | $30,908M | 3.41% |
| Rest of Asia Pacific | $1,236M | $1,291M | $1,386M | $1,516M | $39,861M | 3.80% |
| Total | $18,260M | $18,639M | $19,524M | $21,134M | $478,834M | 4.41% |
Three things stand out from the numbers:
- The Americas get half the money. The region produced 41.4% of fiscal 2026 net sales but 50.9% of selling and marketing expense (my calculation). It is also the only region where the ratio is above 5%.
- Marketing grew slower than sales. From fiscal 2023 to 2026, selling and marketing rose 15.7% while net sales rose 24.9% (my calculation). In fiscal 2026 alone, S&M grew 8.2% against 15.1% sales growth, so the ratio fell from 4.69% to 4.41%.
- Greater China spending tracks sales. S&M there dipped in fiscal 2024 and 2025 while China sales fell, then rose 16% in fiscal 2026 as China sales rose 28%, per the same filing.
What the line includes: the 10-K does not itemize it. Segment operating expenses are described as those “directly attributable to the segment”, and the segment table books R&D and general and administrative costs in a separate Corporate column. AppleA pre-2016 Apple 10-K stated thatrsquo;s fiscal 2015 and 2016 10-Ks stated that “advertising expenses are generally included in the geographic segment in which the expenditures are incurred”, so advertising most likely sits inside these regional figures, alongside sales and retail staff and other selling costs. Treat $21.1 billion as Apple’s total cost of selling and marketing, not its media budget.
For scale: total SG&A was $29,774 million in fiscal 2026 (6.2% of net sales), and R&D was $45,765 million (9.6%). Apple spends more than twice as much on R&D as on selling and marketing. Apple’s only comment on the SG&A increase was that it was “driven by various factors, none of which were significant individually or in the aggregate.”
Apple advertising expense: last disclosed at $1.8 billion (fiscal 2015)
The fiscal 2015 10-K reads: “Advertising costs are expensed as incurred and included in selling, general and administrative expenses. Advertising expense was $1.8 billion, $1.2 billion and $1.1 billion for 2015, 2014 and 2013, respectively.” The same filing attributes part of the SG&A increase to “higher spending on marketing and advertising.”
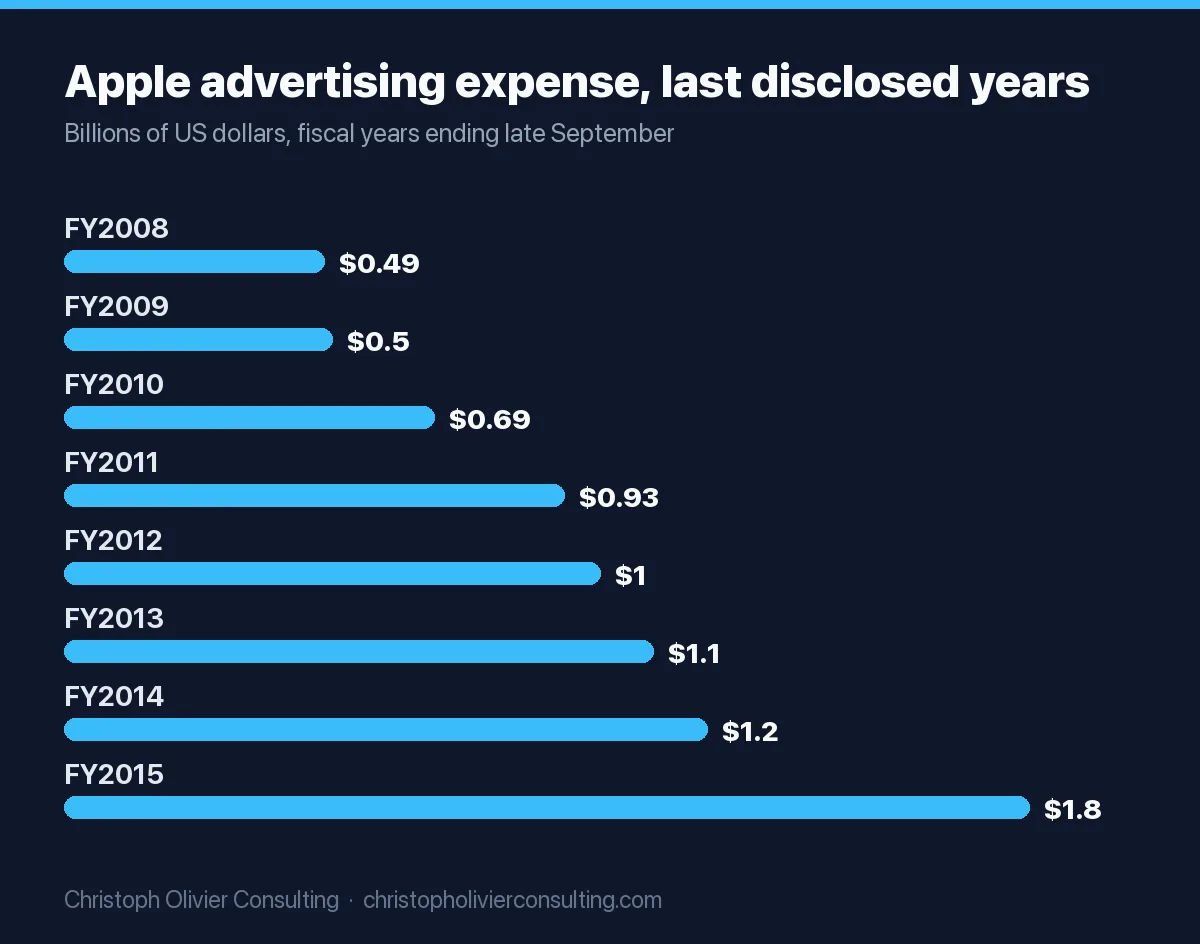
The fiscal 2016 10-K kept the first sentence and removed the amount. It also explained that SG&A decreased in 2016 “due primarily to lower discretionary expenditures and advertising costs.” So the one clue Apple left is that advertising went down, not up, in the first year it stopped reporting it. The current fiscal 2026 10-K contains no advertising expense sentence at all.
Across the eight disclosed years, advertising ran between 10.0% and 12.9% of Apple’s SG&A and between 0.64% and 1.30% of net sales (my calculation from the table above). Apple’s advertising grew 3.7 times from fiscal 2008 to 2015 while its net sales grew 6.2 times.
What can you infer about Apple’s ad spend today?
Not a figure you could cite as fact. You can, however, build bounded scenarios and be honest that they are scenarios. Here is my worked example, using only Apple’s own numbers:
| Scenario (my assumption) | Math | Implied FY2026 advertising | How reliable |
|---|---|---|---|
| A. Advertising stayed at the FY2015 share of net sales (0.77%) | $478,834M × ($1,800M / $233,715M) | about $3.7 billion | Weak: Apple said ad costs fell in FY2016, so the ratio did not stay fixed |
| B. Advertising stayed at the FY2015 share of SG&A (12.6%) | $29,774M × ($1,800M / $14,329M) | about $3.7 billion | Weak: SG&A now includes a much larger retail and services operation |
| C. Ceiling: all selling and marketing were advertising | Reported S&M | $21.1 billion (upper bound, not an estimate) | Certain as a ceiling, certainly too high as a point estimate |
Both ratio methods land near $3.7 billion, which is a useful sanity check, but neither is Apple’s number and both assume a 2015 mix that Apple itself says changed. If you must quote something, quote the $21.1 billion selling and marketing figure with its label, or the $1.8 billion fiscal 2015 figure with its year.
Third-party estimates and why they disagree
Ad-tracking firms measure only the media they can see. MediaRadar’s Apple profile, for example, says Apple spent “over $100 million” on digital, print and national TV in the last year, an estimate MediaRadar says it calculates “using proprietary algorithms based on medium and advertisement type.” That is a tracked-media estimate for specific channels, not a company budget, which is why it is nowhere near the scenarios above. Round figures such as “$1.9 to $2 billion a year” that circulate on social posts usually trace back to the old 2015 filing figure, not to anything current.
Is the Apple number you found real? A 6-point check
Use this before you put any Apple marketing figure in a deck, an article or a board memo. A figure needs to pass all six.
| # | Check | Pass | Fail |
|---|---|---|---|
| 1 | Fiscal year stated | “FY2026, year ended Sep 26, 2026” | “Apple spends $X a year” with no year |
| 2 | Line item named | “Selling and marketing” or “advertising expense” | “Marketing budget” with no definition |
| 3 | Source is a filing or a named measurement firm | Links to a 10-K on sec.gov, or names the tracker | Cites another blog or no one |
| 4 | Year is consistent with disclosure history | Advertising figures for FY2008 to FY2015 only | An “advertising expense” figure for 2020 or later |
| 5 | Estimate labeled as an estimate | “Tracked media, estimated by X” | Estimate presented as Apple’s spend |
| 6 | Ratio uses the same filing’s revenue | $21,134M / $478,834M = 4.4% | Mixes fiscal 2015 ads with 2026 revenue |
Apple vs Google, Microsoft, Meta, Amazon and Nike
Peers report two kinds of line: a broad sales and marketing expense, and a narrower advertising figure in the notes. Apple now reports only the first. The table keeps each company’s own wording, and each percentage is my calculation using revenue from the same filing.
| Company, fiscal year | Sales and marketing line (as named) | % of revenue | Advertising figure (as named) | % of revenue |
|---|---|---|---|---|
| Apple, FY to Sep 2026 | Selling and marketing $21,134M | 4.4% | Not disclosed since FY2015 | n/a |
| Alphabet, 2025 | Sales and marketing $28,693M | 7.1% | Advertising and promotional expenses about $9.9B | 2.5% |
| Microsoft, FY to Jun 2026 | Sales and marketing $26,710M | 8.0% | Advertising expense $2.7B | 0.8% |
| Meta, 2025 | Marketing and sales $11,991M | 6.0% | Advertising expenses $2.09B | 1.0% |
| Amazon, 2025 | Sales and marketing $47,129M | 6.6% | Advertising and other promotional costs $23.5B | 3.3% |
| Nike, FY to May 2026 | n/a (reports demand creation instead) | n/a | Demand creation expense $4,754M | 10.2% |
Apple has the lowest selling and marketing ratio of the big tech companies in this table, at 4.4% of revenue. In absolute dollars its $21.1 billion is below Alphabet’s $28.7 billion and Microsoft’s $26.7 billion. Our page on what Microsoft, Meta, Google and Samsung spend on ads has the five-year trend for those peers, and big brand marketing budgets covers Nike, Coca-Cola, Amazon and others outside tech.
Why Apple can spend so little relative to its size
Apple’s filings point to the reasons without saying it outright. It sells through its own retail and online stores, a direct sales force, carriers and resellers, and the fiscal 2026 10-K notes that its reseller programs include “developing and making digital marketing assets available to resellers.” Part of the cost of putting Apple products in front of buyers therefore sits on carrier and reseller marketing budgets, not Apple’s. Apple also discloses “accrued distribution and marketing” of $6,994 million at the end of fiscal 2026 ($8,919 million a year earlier), a liability for amounts owed to channel partners and others for marketing and distribution.
The bigger reason is scale. Selling and marketing per dollar of sales falls as revenue grows faster than the sales organization. Apple’s ratio fell from 4.76% in fiscal 2023 to 4.41% in fiscal 2026 even as the dollar amount rose by $2.9 billion. Compare that with the advertising to sales ratio by industry: Apple’s fiscal 2015 advertising ratio of 0.77% sits at the very low end for consumer brands.
Apple as an ad seller: what Apple Ads costs advertisers
Some searches for “Apple advertising budget” are from app developers setting a budget in Apple Ads (the product formerly called Apple Search Ads), not from people asking what Apple spends. Apple is now a meaningful ad seller: the fiscal 2026 10-K says Services net sales grew “primarily due to higher net sales from advertising and cloud services”, and the fiscal 2025 10-K credited “advertising, the App Store and cloud services.” Apple does not disclose advertising revenue as a separate number.
How Apple Ads budgets work, per Apple’s own pages:
- Daily budget, monthly cap. Apple’s Manage budgets help page says monthly spend is “the average number of days in a month (30.4) times your daily budget.” Spend can exceed the daily figure on busy days but not the monthly cap. A $50 daily budget therefore caps a month at $1,520.
- Lifetime budgets are gone. The same page says “All campaigns that used lifetime budget were paused in June 2026.”
- Basic pays per install. Apple Ads Basic lets you “pay only for installs at a price you set”, with a suggested max cost per install and a monthly budget.
- Advanced pays per tap. Apple Ads Advanced uses cost-per-tap (CPT) bidding across the Today tab, Search tab, search results and product pages. Apple states over 850 million weekly App Store visitors and an average conversion rate over 60% for ads at the top of search results (Apple’s own claims).
- Free credit. Both pages offer eligible new developers a 100 USD credit.
If you are running app campaigns, pair paid budgets with organic work on your listing; our App Store optimization guide covers the listing side.
Does Apple take 30% or 15%?
Both, depending on the developer and product. Under the App Store Small Business Program, developers with up to 1 million USD in proceeds in the prior calendar year (and new developers) pay a reduced 15% commission on paid apps and in-app purchases. For auto-renewable subscriptions, Apple’s subscriptions page says developers receive 70% of the price in a subscriber’s first year and 85% after one year of paid service, so Apple’s share falls from 30% to 15%. Small Business Program members get 85% from the start.
What Apple’s numbers mean for your own marketing budget
Apple’s 4.4% is the output of a $479 billion business with a global retail footprint, carrier partners who co-fund promotion and a brand that is already known. It is a poor benchmark for a firm that still has to earn attention. In my view, the useful lessons are structural, not the ratio itself:
- Budget by region or segment, then review. Apple’s own filing says marketing investment is allocated by geographic segment and reviewed against segment results. You can do the same by service line or market.
- Separate selling costs from media. Apple’s S&M line bundles people, stores and media. Track your sales staff, agency fees and paid media as separate lines so you know which one drives growth.
- Expect the ratio to fall as you scale, not the dollars. Apple’s S&M dollars rose every year from fiscal 2023 to 2026 while the ratio fell.
For a working method with benchmarks, see how to set a marketing budget and the survey data in marketing budget benchmarks. If you want a second opinion on your own split, you can book a consultation.
Related questions people ask
Which company has the highest advertising budget?
Of the companies on this page, Amazon reports the largest advertising figure: $23.5 billion of “advertising and other promotional costs” in 2025, per its 10-K. Lists of “top 10 advertisers” from measurement firms rank tracked media instead and will not match filing figures. A Super Bowl spot is a separate question; our Super Bowl commercial cost page covers it.
What is Nike’s marketing budget?
Nike reports “demand creation expense”, its advertising and promotion line: $4,754 million in the fiscal year ended May 31, 2026, against revenue of $46,398 million, or 10.2% (my calculation). That ratio is more than double Apple’s selling and marketing ratio.
Is Apple a $4 trillion company?
Apple’s fiscal 2026 10-K states that the market value of shares held by non-affiliates was about $3,647 billion on March 27, 2026, and that 14,532,182,000 shares were outstanding on October 23, 2026. At that share count, Apple’s market value is $4 trillion whenever the share price is at or above about $275.25 (my calculation: $4 trillion divided by shares outstanding). Check the current price to answer for today.
Ready to scale your revenue?
Book a free 30-min consultation. We’ll diagnose your growth bottleneck and map out the 3 highest-leverage moves for your business.
Frequently asked questions
How big is Apple's marketing budget?
Apple reported $21,134 million of selling and marketing expense in fiscal 2026, the year ended September 26, 2026, in the segment note of its 10-K. That was about 4.4% of $478,834 million in net sales. The line covers all selling and marketing costs, including sales staff, not only advertising. Fiscal 2025 was $19,524 million.
How much does Apple spend on advertising every year?
Apple has not disclosed its advertising expense since fiscal 2015, when its 10-K reported $1.8 billion, up from $1.2 billion in 2014 and $1.1 billion in 2013. The fiscal 2016 10-K said advertising costs fell that year and dropped the amount. Current figures you see online are third-party estimates of tracked media.
What was Apple's marketing budget in 2025?
In fiscal 2025, the year ended September 27, 2025, Apple's selling and marketing expense was $19,524 million, against net sales of $416,161 million, or about 4.7%. The Americas region accounted for $10,174 million of that. Apple did not report a separate advertising figure for 2025.
Does Apple spend less on advertising than its competitors?
Relative to revenue, yes on the filing data available. Apple's selling and marketing was 4.4% of revenue in fiscal 2026, versus 7.1% for Alphabet, 8.0% for Microsoft and 6.0% for Meta on their latest sales and marketing lines. Apple's last disclosed advertising ratio, 0.77% of sales in fiscal 2015, was also low.
How much do Apple Ads cost?
Apple Ads has no fixed price. Apple Ads Basic charges per install at a maximum cost per install you set, within a monthly budget. Apple Ads Advanced charges per tap, with a maximum cost per tap you set. Monthly spend is capped at 30.4 times your daily budget, and eligible new accounts get a 100 USD credit.
What big companies spend on marketing