

A real estate agent should plan to spend about 3% to 10% of gross commission income (GCI) on marketing, and the right point in that range depends on how much of your business comes from past clients versus strangers. The 3% end is what agents actually spend: on their 2023 tax returns, self-employed agents and brokers reported advertising equal to 3.38% of business receipts, about $2,143 per return (IRS Statistics of Income, Table 2). The 10% end is the coaching rule of thumb. For a typical Realtor earning the NAR median gross income of $59,200, that is roughly $2,000 to $5,900 a year.
Short answer: Budget 3% to 5% of GCI if most of your deals come from your sphere and referrals, and 8% to 12% if you buy leads or run ads to reach strangers. Then check the percentage against cost per closing: a lead source is only affordable if what it costs to close one deal stays well under the commission you keep from that deal. In the worked example below, Google Ads leads at the 2026 real estate average of $102.51 break even at a 2% lead-to-close rate.
Below: what agents really spend according to NAR and IRS data, why vendor advice runs higher, budgets by experience level, a copy-ready budget calculator, what Zillow and Realtor.com leads cost per their own pages, and how the 3-3-3, 70/20/10 and 80/20 rules apply to an agent’s money.
How much do real estate agents spend on marketing?
Three different data sets answer this, and they measure different things. Read them together.
Total business expenses. NAR’s 2026 Member Profile (released June 25, 2026, covering 2025) puts the typical Realtor’s total business expenses at a median of $9,530, up from $8,010 in 2024. The largest single category was vehicle costs at $1,580. Marketing is a slice of that $9,530, not the whole thing.
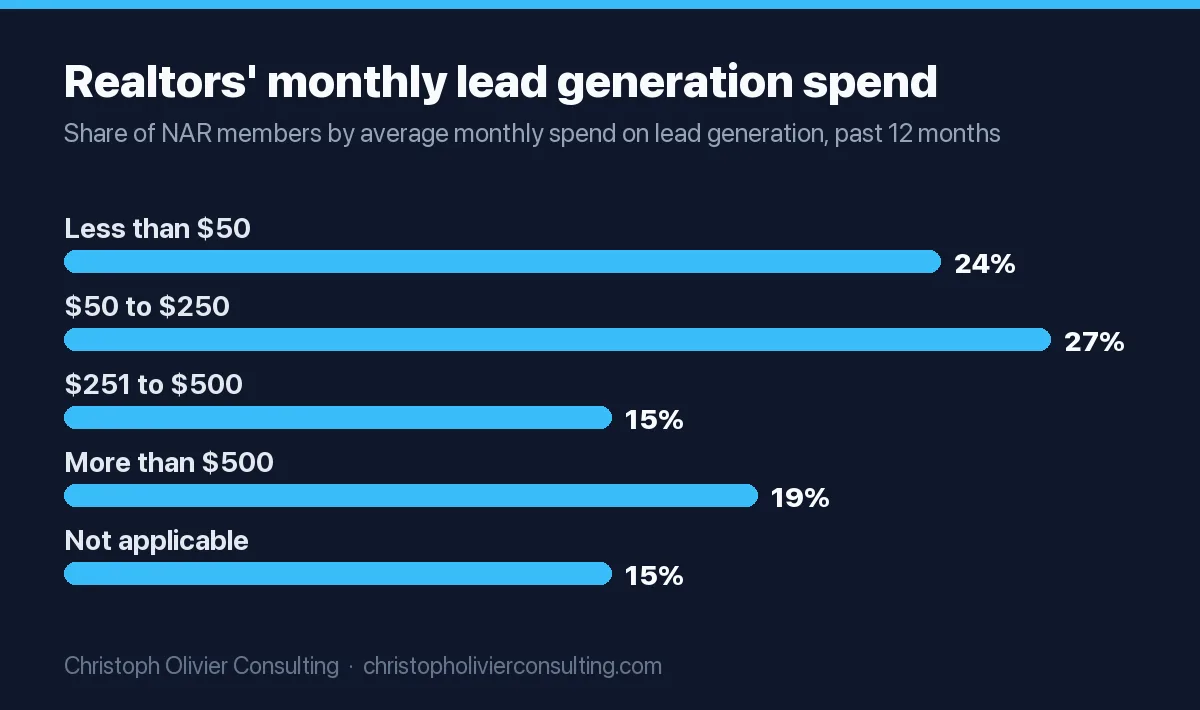
Monthly lead generation spend. In NAR’s 2025 Technology Survey (1,241 usable responses, July 2025, margin of error 2.78 points), half of Realtors spent $250 a month or less on lead generation: 24% spent under $50 and 27% spent $50 to $250. Only 19% spent more than $500 a month.
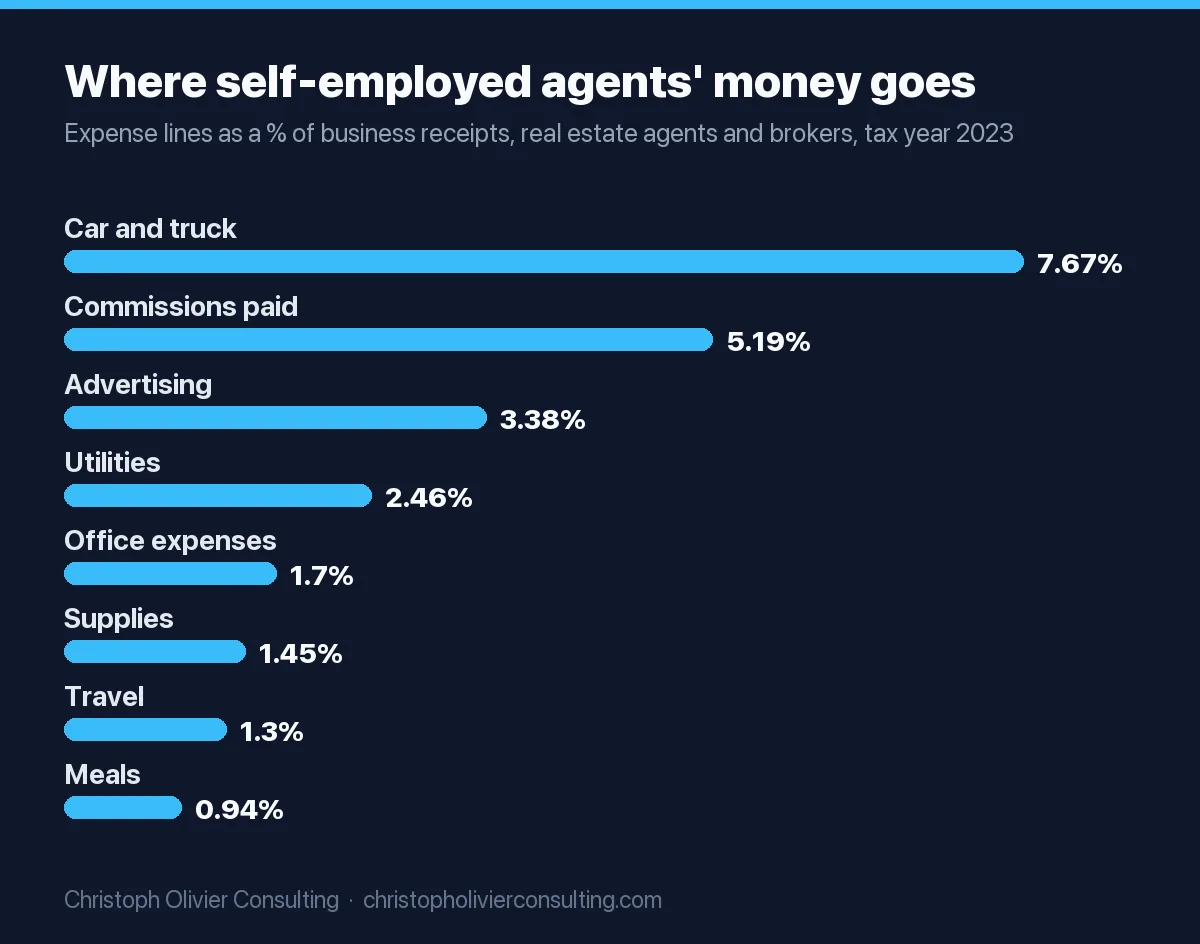
Advertising on tax returns. The IRS sole proprietorship table for tax year 2023 covers 1,046,471 returns in “offices of real estate agents, brokers, property managers and appraisers.” Together they reported $66.26 billion in business receipts and $2.24 billion in advertising expenses (IRS SOI Table 2). That is 3.38% of receipts, almost three times the 1.18% ratio for all nonfarm sole proprietors in the same table (our calculation). Note what the IRS line excludes: a CRM subscription, a website or a coach may be booked as office expense, software or “other,” so true marketing spend is somewhat higher than 3.38%.
Vendor surveys. Luxury Presence, a real estate website and marketing company, reports from its own 2024 State of Real Estate Marketing survey that agents spent an average of $12,725 on marketing in 2023 and over $14,200 in 2024. Its respondents skew toward agents who already buy marketing services, which is why the figure sits well above the NAR and IRS numbers.
| Measure | Figure | Who is counted | Period | Source |
|---|---|---|---|---|
| Total business expenses (median) | $9,530 | NAR members (all expenses, not only marketing) | 2025 | NAR 2026 Member Profile |
| Vehicle costs (median, largest category) | $1,580 | NAR members | 2025 | NAR 2026 Member Profile |
| Lead generation spend of $250 a month or less | 51% of Realtors | 1,241 surveyed Realtors | 12 months to July 2025 | NAR 2025 Technology Survey |
| Lead generation spend above $500 a month | 19% of Realtors | 1,241 surveyed Realtors | 12 months to July 2025 | NAR 2025 Technology Survey |
| Advertising as a share of business receipts | 3.38% (our calculation) | 1,046,471 sole proprietor returns, agents, brokers, property managers, appraisers | Tax year 2023 | IRS SOI Table 2 |
| Advertising per return (average) | $2,143 (our calculation) | Same returns | Tax year 2023 | IRS SOI Table 2 |
| Average marketing spend, vendor survey | $12,725 (2023), over $14,200 (2024) | Luxury Presence survey respondents | 2023 to 2024 | Luxury Presence |
The IRS table also shows where the rest of an agent’s money goes. Car and truck costs (7.67% of receipts) and commissions paid out (5.19%, which includes referral fees and payments to other agents) both outweigh advertising. If you are looking for budget to move into marketing, those two lines are the place to look first.
Realtor marketing budget percentage: 3%, 10% or 20%?
The percentage you see quoted depends on who is quoting it.
- 3.38% of receipts: what self-employed agents and brokers actually deducted for advertising in 2023, per the IRS (our calculation).
- 5% to 10% of GCI, 10% to 15% in competitive markets: the benchmark in Tom Ferry’s marketing budget guide, with a sample $15,000 split of 40% digital ads, 20% content and SEO, 15% local branding, 15% CRM and nurture, 7% photography and design and 3% client retention.
- 7% to 12% of GCI: Luxury Presence for 2026, rising to 10% to 12% for agents under $100,000 in GCI.
None of the vendor percentages come with published data showing that agents who spend 10% earn more than agents who spend 3%. They are planning conventions from companies that sell marketing to agents. That does not make them wrong, but it means you should treat 10% as a ceiling to justify with numbers, not a floor to hit.
Two definitions trip people up. GCI is the commission before your brokerage split. “Gross income” in the NAR Member Profile is what members earned from real estate, and the IRS “receipts” figure is what the business reported on Schedule C. A 10% budget on $100,000 of GCI is $10,000. If your split is 70/30, that $10,000 is about 14% of what you keep (our calculation), which is why newer agents on low splits feel a 10% rule much harder.
Real estate agent marketing budget by experience level
The table applies two percentages to NAR’s 2025 income medians. The 3.38% column is the IRS reality check. The 10% column is the coaching rule. The dollar figures are our calculations, not survey results.
| Agent profile | Income base (source) | At 3.38% (IRS actual ratio) | At 10% (rule of thumb) | What the budget should buy first |
|---|---|---|---|---|
| New agent, 2 years or less | $8,000 median gross income (NAR) | $270 | $800 | A percentage cannot fund a pipeline here. Use a fixed monthly amount from the calculator below, aimed at your sphere and one paid test. |
| Typical Realtor, 9 sides | $59,200 median gross income (NAR) | $2,001 | $5,920 | CRM and past client touches first, then one lead source you can measure to the closing. |
| Veteran, 16+ years | $88,500 median gross income (NAR) | $2,991 | $8,850 | Referral and repeat programs. Half of the typical Realtor’s business already comes from repeat clients and referrals. |
| Team, 32 sides | About $423,500 GCI (our estimate: $17.5M median volume x 2.42% avg buyer commission) | $14,314 | $42,350 | Paid lead sources sized by cost per closing, plus listing marketing as a cost of each listing. |
The team GCI is a rough estimate: it applies Redfin’s average buyer’s agent rate to every side, while listing-side rates differ by market and contract. Swap in your own trailing 12 months of GCI.
The new agent row is the honest answer to “how much should a new real estate agent spend on marketing”: NAR’s median for agents with two years or less was $8,000 of gross income in 2025, so 10% is $800 a year. That is why the cost-per-closing method below works better than any percentage when you are starting out. If you have not yet worked out how many deals your income goal requires, start with our walkthrough on how many clients real estate agents have.
The cost-per-closing method (copy-ready budget calculator)
A percentage tells you what you can afford. Cost per closing tells you what a lead source will actually cost you. Copy this worksheet into a spreadsheet and replace the example column with your own numbers.
| Step | Formula | Example | Where the example number comes from |
|---|---|---|---|
| 1. Net income goal from real estate | Your number | $90,000 | Example input |
| 2. Commission per side (GCI) | Average price x commission rate | $300,000 x 2.42% = $7,260 | $2.7M median volume / 9 sides (NAR); 2.42% Q3 2025 average (Redfin) |
| 3. What you keep per side | Step 2 x your split | $7,260 x 70% = $5,082 | 70% is an example split; use yours |
| 4. Closings needed | Step 1 / Step 3, rounded up | $90,000 / $5,082 = 18 | Calculation |
| 5. Closings from sphere, repeat and referral | Step 4 x your sphere share | 18 x 50% = 9 | 28% repeat + 22% referral business for the typical Realtor (NAR) |
| 6. Closings you must buy or prospect | Step 4 minus Step 5 | 9 | Calculation |
| 7. Cost per closing for your paid source | Cost per lead / lead-to-close rate | $102.51 / 5% = $2,050 | Real estate search ads CPL (LocaliQ 2026); 5% close rate is an example, use your CRM data |
| 8. Paid budget | Step 6 x Step 7 | 9 x $2,050 = $18,450 | Calculation |
| 9. Sphere budget | Your monthly sphere spend x 12 | $250 x 12 = $3,000 | Example input (CRM, mail, client events) |
| 10. Total annual marketing budget | Step 8 + Step 9 | $21,450, or $1,788 a month | Calculation |
| 11. Sanity check as % of GCI | Step 10 / (Step 4 x Step 2) | $21,450 / $130,680 = 16.4% | Calculation |
Step 11 is the useful surprise. An agent who buys half of their deals lands well above the 10% rule, while an agent whose deals come 80% from their sphere lands near the IRS average. The percentage is an output of your lead mix, not an input. To build the month-by-month plan around these numbers, use our real estate marketing plan template.
Break-even close rates for common lead sources
The break-even close rate is the lead-to-close rate at which one closing costs exactly what you keep from it. Below that rate, the source loses money. Formula: cost per lead / commission kept per side. All rows use the $5,082 example from step 3; these are our calculations.
| Lead source | Published cost | Break-even close rate | Close rate needed to spend no more than 25% of the side on the lead |
|---|---|---|---|
| Google search ads, real estate | $102.51 per lead (LocaliQ 2026) | 2.0% | 8.1% |
| Zillow Premier Agent, non-major metro | $139 average per connection (Zillow) | 2.7% | 10.9% |
| Zillow Premier Agent, major metro | $223 average per connection (Zillow) | 4.4% | 17.6% |
The 25% column is a planning guardrail I use, not an industry standard: it leaves room for brokerage fees, transaction costs and the months when a lead source underperforms. If your CRM does not yet record lead source and closing for every contact, fix that before you raise any budget. The wider channel comparison lives in our guide to lead generation for real estate agents, and cross-industry numbers are in average cost per lead by industry.
How much do real estate agents spend on advertising with Zillow and Realtor.com?
Portal leads are where budgets get large quickly, and the two biggest portals price differently. Everything below was read on the vendors’ own pages on November 16, 2026.
| Product | Pricing model | Published price | What it means for your budget |
|---|---|---|---|
| Zillow Premier Agent | Advertising package, priced per connection; 6-month contracts recommended, not required | Average $223 per connection in major metros, $139 in non-major metros; exact price is quote only | Fixed monthly spend you pay whether or not you close. Size it with the break-even table above. |
| Zillow Preferred | Success fee paid only when a connection closes | 40% of your expected commission on seller-originated connections; buyer-side fee varies by ZIP code and price (quote only) | No upfront cost, but on a $7,260 side a 40% fee is $2,904 (our calculation). Budget it as a cost of sale, not ad spend. |
| Realtor.com Connections Plus | Single upfront cost for a predictable volume of buyer and seller connections | Quote only | Treat like Premier Agent: fixed spend, measure cost per closing. |
| Realtor.com ReadyConnect Concierge | Live-transferred, pre-screened leads; referral fee on closed transactions, no upfront cost | Referral fee rate not published on the page (quote only) | Like Zillow Preferred: a cost of sale that reduces your net per side. |
Zillow also states that agents using Premier Agent close 60% more transactions than agents who do not. That is Zillow’s own data on its own product and does not show cause and effect, so weigh it accordingly. For how pay-at-close fees compare with normal agent-to-agent referral fees, see our breakdown of the real estate agent referral fee.
Where the money should go
NAR’s data points to an uncomfortable fact for anyone selling agents leads: the typical Realtor got 28% of their business from repeat clients and 22% from referrals in 2025 (NAR Feature Sheet). When asked which technology produced the most quality leads, 39% of Realtors named social media, 23% their CRM and 17% the local MLS, while 12% named digital ad campaigns (NAR 2025 Technology Survey). The cheapest leads come from people who already know you.
A starting split by stage, which is my recommendation rather than survey data:
| Budget line | New agent (fixed $150 to $300 a month) | Established solo agent (3% to 6% of GCI) | Team or paid-lead agent (8% to 15% of GCI) |
|---|---|---|---|
| CRM and database touches (calls, notes, mail) | 40% | 35% | 15% |
| Social and video content | 30% | 20% | 10% |
| Paid leads or ads (one source at a time) | 20% (a test) | 25% | 60% |
| Client events and gifts | 10% | 15% | 10% |
| Website, SEO, brand | 0% (use your brokerage site) | 5% | 5% |
Listing marketing (photos, video, staging, print for a specific property) is better treated as a cost of that listing than as part of your annual brand budget, because it scales with listings rather than with your goals.
How the NAR settlement changes the math
Since the practice changes took effect on August 17, 2024, offers of buyer agent compensation can no longer be communicated through the MLS, and agents working with buyers need a written agreement before touring a home (NAR settlement FAQs). Commission is negotiated, deal by deal.
So far the effect on average rates has been small. Redfin reports the average buyer’s agent commission was 2.42% in Q3 2025, up from 2.36% a year earlier, with 2.52% on homes under $500,000 and 2.22% on homes of $1 million or more. For budgeting, the lesson is to stop assuming a flat 3%: plug your own average from the last 12 closings into step 2 of the calculator. A 0.5 point drop in your rate on a $300,000 home cuts $1,500 from every side (our calculation), which moves every break-even close rate up.
The 3-3-3, 70/20/10 and 80/20 rules for realtors
What is the 3-3-3 rule in real estate?
It is a relationship marketing habit from real estate coach Darryl Davis (Darryl Davis, June 2025): every month, call 3 people (clients, past clients or prospects), send 3 personal handwritten notes, and share 3 pieces of value such as a neighborhood market snapshot or a home maintenance checklist. In budget terms it costs almost nothing but stamps and time, which is why it belongs in the sphere line of every agent’s budget, including a new agent with $150 a month.
What is the 70/20/10 rule for a marketing budget?
As described in Entrepreneur (August 2026), you split the budget into 70% for proven channels where you can trace dollars to customers, 20% for promising bets and 10% for true experiments, then rebalance quarterly. The same article anchors the total at 10% of projected gross sales. For an agent, the 70% is whatever your CRM shows closing at an acceptable cost per closing (often your sphere), the 20% is a second lead source on trial, and the 10% is a small test such as one month of video ads. Only move a channel into the 70% bucket after it passes the break-even check above.
What is the 80/20 rule for realtors?
The 80/20 rule (the Pareto principle) says a small share of causes produces most of the results. For agents, it shows up in where business comes from: the typical Realtor drew half of 2025 business from repeat clients (28%) and referrals (22%) per NAR. The budget version: protect the money that keeps you in front of past clients first, and fund paid sources only to the extent your calculator says they pay back.
Budget review checklist (pass or fail)
- Every closing in the last 12 months has a lead source in your CRM. Fail if any are blank: you cannot price a channel you cannot trace.
- Each paid source has a cost per closing below what you keep per side. Fail if any source is above its break-even close rate for two quarters running.
- Your total budget as % of GCI matches your lead mix. Sphere-heavy business near 3% to 5%, paid-heavy business near 10% or more. Fail if you are paying 10% but getting most deals from referrals.
- Pay-at-close fees are in your net commission math. Fail if a 40% success fee is not in your income forecast.
- You tested one new source at a time for at least 6 months. Zillow itself recommends 6 months as the minimum to judge Premier Agent (Zillow).
If your numbers fail two or more of these and you want a second set of eyes on the channel mix, you can book a consultation. For the wider picture on how buyers and sellers find agents, see our real estate marketing statistics.
Ready to scale your revenue?
Book a free 30-min consultation. We’ll diagnose your growth bottleneck and map out the 3 highest-leverage moves for your business.
Frequently asked questions
How much do real estate agents spend on marketing per year?
It varies widely. NAR's 2026 Member Profile puts the typical Realtor's total business expenses at $9,530 for 2025, of which marketing is only part. IRS data for tax year 2023 shows self-employed agents and brokers deducted advertising equal to 3.38% of receipts, about $2,143 per return. Vendor surveys of marketing-active agents report averages above $14,000.
How much do real estate agents spend on advertising each month?
In NAR's 2025 Technology Survey, 24% of Realtors spent under $50 a month on lead generation, 27% spent $50 to $250, 15% spent $251 to $500 and 19% spent more than $500. In other words, about half spend $250 a month or less, and fewer than one in five spend above $500.
What percentage of GCI should a realtor spend on marketing?
Plan on 3% to 5% of GCI if most deals come from your sphere and referrals, and 8% to 12% if you buy leads or run ads. Coaching and vendor guides quote 5% to 15%, while IRS data shows agents actually spend about 3.4% of receipts on advertising. Confirm any percentage with cost per closing.
How much should a new real estate agent spend on marketing?
Use a fixed monthly amount, not a percentage. NAR reports agents with two years or less earned a median of $8,000 gross in 2025, so 10% would be only $800 a year. Work backward from the closings you need, fund your sphere first, and test one paid source at a time.
How much does Zillow Premier Agent cost?
Zillow quotes Premier Agent pricing individually, but its own page states an average cost per connection of $223 in major metros and $139 in non-major metros (read November 2026). Zillow Preferred instead charges a success fee at closing: 40% of your expected commission on seller connections, with buyer fees varying by ZIP code.
What is the 3-3-3 rule in real estate?
It is a monthly relationship marketing routine taught by coach Darryl Davis: call three clients, past clients or prospects, send three handwritten personal notes, and share three useful pieces of content such as a market snapshot or maintenance checklist. It costs little beyond time and postage, so it fits any agent's budget.
What is the 70/20/10 rule for a marketing budget?
Put 70% of the budget into channels already proven to produce customers, 20% into promising channels you are testing, and 10% into small experiments, then rebalance each quarter. For an agent, the 70% is usually sphere and referral marketing plus any paid source that already closes below its break-even cost.
Marketing budget research