
Color psychology in marketing is real, but it is narrower than most guides claim. Peer-reviewed studies show that hue shifts how people read a brand’s personality and whether a color feels appropriate for what you sell, and that the same color can mean opposite things in different contexts. They do not show fixed color meanings, a universal “trust blue,” or a best button color.
Below, every popular claim is graded against its source, including the “62 to 90 percent of judgment is color” statistic and HubSpot’s famous red button test, both traced to the original documents. Then you get the WCAG contrast rules your palette must pass, a brand color worksheet tied to brand archetypes, and the sample-size math for testing a color change.
Color psychology claims, graded by evidence
Each claim carries one of four grades: supported (peer-reviewed experiments, more than one study), context-bound (lab evidence exists, but the effect depends on product, setting or audience), overstated (a real finding stretched beyond what was tested), or untraceable (no study behind the number).
| Popular claim | Grade | What the source actually shows |
|---|---|---|
| Color changes how people perceive a brand | Supported | Labrecque and Milne ran four studies mapping hue to brand personality, purchase intent, likability and familiarity (Journal of the Academy of Marketing Science, 2012). Bottomley and Doyle ran two experiments on logo color (Marketing Theory, 2006). |
| Fit with the product matters more than any one “best” color | Supported | Functional products were judged more appropriate in functional colors, sensory-social products in sensory-social colors (Bottomley and Doyle, Experiment 1). |
| Red reads as exciting, blue as competent | Context-bound | The pairing is the headline finding of Labrecque and Milne. Elliot’s 2015 review lists blue logos and websites raising trust and quality ratings, but also lists studies that did not find it. |
| Blue builds trust, everywhere | Overstated | In a 30-nation study, blue did not reach the threshold for any prominent emotion association (Jonauskaite et al., Psychological Science, 2020). |
| Color meanings are universal | Overstated | Color-emotion patterns were highly similar across nations (average r = .88), yet a classifier could still tell which nation a respondent came from. |
| Red makes a person more attractive | Context-bound, and shrinking | A meta-analysis found small effects (d = 0.26 for men rating women, d = 0.13 for women rating men) that may have declined over time (Lehmann, Elliot and Calin-Jageman, 2018). |
| 62 to 90 percent of a first judgment is based on color alone | Untraceable | Appears in the abstract of a 2006 literature review with no citation in the body. Details below. |
| Red buttons convert better than green | Overstated | One 2011 test on one homepage, about 2,000 visits, no significance reported. Details below. |
| “Nearly 85% of consumers name color as the primary reason” they buy | Untraceable | Repeated on WebFX’s color psychology infographic page with no study named. |
The pattern is consistent. The defensible findings are about fit and context. The viral numbers are the ones without a traceable study.
What peer-reviewed research on color in marketing actually shows
Hue maps onto brand personality (Labrecque and Milne, 2012)
“Exciting red and competent blue” by Lauren Labrecque and George Milne (Journal of the Academy of Marketing Science, vol. 40, no. 5, pp. 711 to 727) is the most widely cited marketing study in this set (OpenAlex counts over 700 citations). Its abstract describes four studies: Study 1 maps hues onto brand personality dimensions, Study 2 tests how saturation and value (lightness) amplify those traits, Study 3 shows marketers can use color to alter brand personality and purchase intent, and Study 4 shows color influences how likable and familiar a brand seems.
Two practical points follow. First, the personality dimensions come from Jennifer Aaker’s brand personality scale: sincerity, excitement, competence, sophistication and ruggedness (Journal of Marketing Research, 1997). So the research question is “which color supports the personality you chose,” not “which color makes people buy.” Second, Study 2 means a hue is not one signal. A pale, desaturated blue and a saturated navy are different decisions.
Appropriateness beats the “right” color (Bottomley and Doyle, 2006)
Paul Bottomley and John Doyle tested logo colors against product types in Marketing Theory. Functional products looked more appropriate in functional colors; sensory-social products looked more appropriate in sensory-social colors. In their second experiment, with red and blue on products that could be positioned either way, people rated the color congruent with the brand’s stated positioning as more appropriate. This is the strongest argument against copying a color chart: the same red that suits an entertainment brand can look wrong on a tax practice.
The same color means different things in different contexts (Elliot and Maier)
Andrew Elliot and Markus Maier’s color-in-context theory holds that some color responses are learned through repeated pairing of color and concept, others are biologically based and shaped by learning, and that the physical and psychological context changes the meaning. Elliot’s 2015 review in Frontiers in Psychology gives the clearest examples: a red shirt may raise a person’s attractiveness to a potential partner but not to someone judging their competence, and blue on a first-place ribbon is positive while blue on a piece of meat means it is rotten.
The same authors are blunt about the limits. Their 2014 Annual Review of Psychology article says the literature “remains at a nascent stage of development” and that work on boundary conditions, moderators and real-world generalizability is needed “before strong conceptual statements and recommendations for application are warranted.” Elliot’s 2015 review adds that much of the research “remains underpowered,” that underpowered samples overestimate effects, and that color is often controlled at the device level, or not at all in web-based studies.
Red and blue change how people think, not just how they feel
In Science (2009), Ravi Mehta and Rui Zhu reported that red induced avoidance motivation and improved performance on detail-oriented tasks, while blue induced approach motivation and improved creative tasks, across six studies with samples from 42 to 208 people, including product design and persuasive-message tasks. For a marketer this is a reminder that “red equals energy” is too simple: red also signals caution, which may suit a compliance checklist better than a brainstorming invitation.
The “62 to 90 percent of judgment is color” statistic, traced
This is the most repeated number in color psychology content. It comes from Satyendra Singh, “Impact of color on marketing,” Management Decision, vol. 44, no. 6, pp. 783 to 789 (2006). The abstract’s exact wording: “People make up their minds within 90 seconds of their initial interactions with either people or products. About 62-90 percent of the assessment is based on colors alone.”
What the paper is, based on the full text:
- A seven-page literature review. Emerald files it as a research paper, but its own design/methodology line says it “reviews the literature relating to color psychology in the context of marketing.” It reports no new data.
- No source for the number. The 90-second and 62 to 90 percent figures appear only in the abstract. The body never repeats them and cites no study for them.
- It undercuts the strong reading itself. The paper says advances in this area came largely from color consultancies whose experiments are “not scientific,” that “the evidence linking specific colors to specific responses is inconclusive,” and, on restaurants, that “no direct evidence that specific restaurants using specific colors increased sales was documented.”
Secondary sources then inflate it. The USC Applied Psychology blog, for example, says color “contributes up to 90 percent of the information that forms the decision,” which turns an unsourced range into a ceiling and a decision rather than an assessment. My advice: do not put this statistic in a pitch deck or brand guide. If you need a citation that color matters, cite Labrecque and Milne or Bottomley and Doyle, which are experiments.
Does blue build trust? What 30 countries say
The best cross-cultural data is Jonauskaite and colleagues’ 2020 study in Psychological Science: 4,598 participants from 30 nations, 22 native languages, associating 20 emotions with 12 color terms. Associations were broadly shared (average pattern similarity r = .88), but a machine-learning classifier still identified a participant’s nation 34.4 percent of the time, and similarity was higher between nations that are linguistically or geographically close.
The table lists the prominent associations the study found (probability of at least 0.4) and the national exceptions the authors call out, from the accepted manuscript.
| Color term | Prominent emotions across 30 nations | Named national exceptions |
|---|---|---|
| Red | Love, anger | Nigerian respondents also linked red with fear |
| Pink | Love, joy, pleasure | None named |
| Yellow | Joy | Egyptian respondents did not link yellow with joy or other positive emotions |
| Orange | Joy, amusement | None named |
| White | Relief | Chinese respondents also linked white with sadness |
| Black | Sadness, fear, hate | None named |
| Grey | Sadness, disappointment | None named |
| Purple | None above the threshold; least consistent color across nations | Greek respondents linked purple with sadness, others with positive emotions |
| Blue, green, turquoise, brown | None above the threshold | None named |
Two caveats keep this honest. The study used color words, not swatches, and it measured emotions, not brand traits such as trust or competence. So it cannot prove blue fails to signal trust. It does show that “blue means trust” is not a universal emotional reflex, which is why the lab finding that blue logos and websites raise trust ratings, listed in Elliot’s 2015 review alongside studies that did not find it, should be read as context-bound.
Mubeen Aslam’s cross-cultural review in the Journal of Marketing Communications (2006) reaches the practical conclusion: because cultural values, marketing objectives and the customer relationship you want all shape color choice, a cross-cultural perspective is “imperative” for global marketing. If you sell in more than one country, check each market rather than assuming your home-market reading travels.
The red button that “converted 21% better”: HubSpot’s 2011 test, read in full
Nearly every button-color article cites this test. The original post is Josh Porter’s “The Button Color A/B Test: Red Beats Green,” published on HubSpot’s blog on 2 August 2011. The original URL now redirects to an unrelated HubSpot article, so here is the archived original. What it actually says:
- Setup: Performable’s homepage, a green button versus an otherwise identical page with a red button.
- Sample: “over a few days of traffic,” with “over 2,000 visits to the page.” No baseline click rate, confidence level or significance test is reported.
- Metric: button clicks, not signups. The first reader comment asks whether the red version also produced more form completions; the post does not say.
- Result: “21% more people clicked on the red button than on the green button.”
- The author’s own caveat: “we cannot generalize these results to all situations,” and red may have won because it “happened to contrast nicely with the green in Performable’s color scheme,” which was green, black and gray.
Now the power math, using the two-proportion formula from our A/B testing guide (alpha 0.05 two-sided, 80% power). With roughly 1,000 visits per version, the chance of detecting a true 21% relative lift depends on the baseline click rate:
| Baseline click rate (green) | Visitors needed per version to detect a 21% lift | Power with about 1,000 per version |
|---|---|---|
| 5% | 7,431 | 18% |
| 10% | 3,498 | 32% |
| 20% | 1,531 | 62% |
| 30% | 876 | Above 80% |
Unless roughly a third of homepage visitors clicked that button, the test was underpowered, which is exactly the condition under which Elliot warns effect sizes come out inflated. The defensible lesson is the one Porter half-states: a button that contrasts with the page gets noticed. That is a contrast and hierarchy effect, not a property of red.
Contrast rules your brand colors must pass (WCAG 2.2)
Accessibility is the one part of color choice that is a rule rather than a probability. WCAG 2.2, a W3C Recommendation dated 12 December 2024, sets these minimums:
| Where the color is used | AA minimum | AAA | Criterion |
|---|---|---|---|
| Normal body text and images of text | 4.5:1 | 7:1 | 1.4.3 / 1.4.6 |
| Large text: at least 18pt (about 24px), or 14pt bold (about 18.5px) | 3:1 | 4.5:1 | 1.4.3 / 1.4.6 |
| Visual information needed to identify UI components and their states, and parts of graphics needed to understand content | 3:1 against adjacent colors | None | 1.4.11 (AA) |
| Any meaning carried by color, such as red for an error | Color must not be the only visual cue | None | 1.4.1 (A) |
Three details from W3C’s Understanding 1.4.3 page catch brand teams out. Ratios are not rounded, so 4.499:1 fails. Text that is part of a logo or brand name has no contrast requirement, but other text that fails “due to corporate identity or brand guidelines” is not exempt. And the 4.5:1 level was set to compensate for contrast loss at roughly 20/40 vision which W3C notes is commonly reported as typical acuity at roughly age 80.
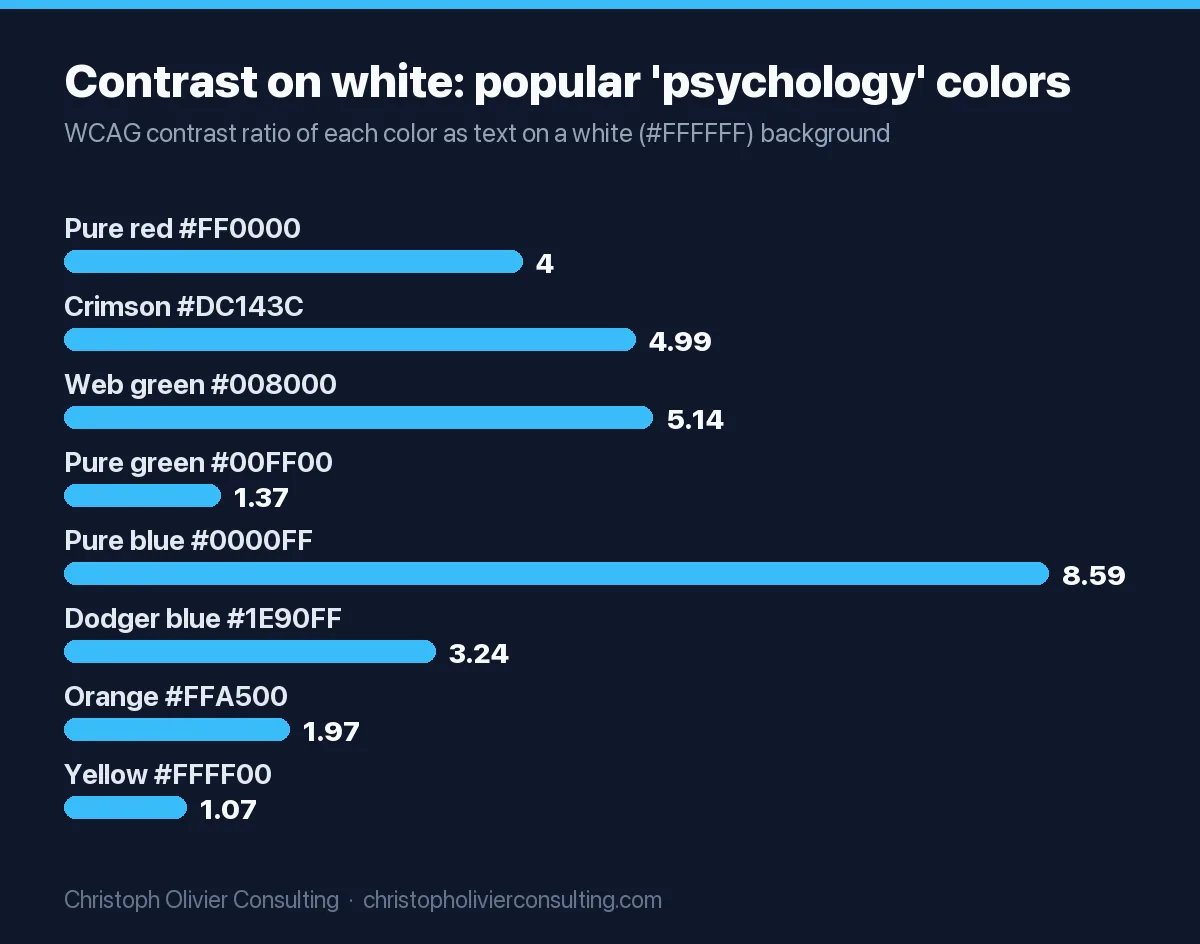
Here is how the saturated colors that color-psychology charts usually show perform as text on a white background. I computed each ratio with the W3C relative-luminance formula:
| Color (hex) | Ratio on white | Body text (4.5:1) | Large text or button edge (3:1) |
|---|---|---|---|
| Pure red #FF0000 | 4.00:1 | Fail | Pass |
| Crimson #DC143C | 4.99:1 | Pass | Pass |
| Web green #008000 | 5.14:1 | Pass | Pass |
| Pure green #00FF00 | 1.37:1 | Fail | Fail |
| Pure blue #0000FF | 8.59:1 | Pass | Pass |
| Dodger blue #1E90FF | 3.24:1 | Fail | Pass |
| Orange #FFA500 | 1.97:1 | Fail | Fail |
| Yellow #FFFF00 | 1.07:1 | Fail | Fail |
| Navy #000080 | 16.01:1 | Pass | Pass |
The same ratio applies in reverse, so white button text on pure red is also 4.00:1: fine at 24px, a fail at a 16px label. Pure red against web green measures only 1.28:1, so a red/green pair should never be the only cue for “stop/go” or “error/success.” For the luminance math worked step by step and a full palette pairing check, use the color section of our brand guidelines guide.
Brand color selection worksheet, tied to your archetype
This worksheet turns the evidence above into a decision. It starts from the personality you chose, because that is what Labrecque and Milne and Bottomley and Doyle actually tested. If you have not chosen an archetype yet, score one with the worksheet on our brand archetypes page first.
Step 1: translate your archetype into a brand personality dimension
The archetype-to-dimension column is our mapping, a practitioner judgment, not a published crosswalk. The hue column only states what the fetched research supports.
| Archetype (Mark and Pearson) | Closest Aaker dimension (our mapping) | Hue evidence, graded |
|---|---|---|
| Sage, Ruler | Competence | Context-bound: blue is the competence hue in Labrecque and Milne; blue logos raised trust ratings in some lab studies, not all |
| Hero, Outlaw, Explorer | Ruggedness or excitement | Context-bound: red is the excitement hue in Labrecque and Milne; red also triggers avoidance (Mehta and Zhu), so use it as an accent near decisions, not across warnings |
| Jester, Magician | Excitement | Context-bound: as above; in the global pattern of Jonauskaite et al., orange and yellow carried joy |
| Innocent, Caregiver, Everyman | Sincerity | Not graded: no hue claim we could verify; choose for differentiation and test |
| Lover, Creator | Sophistication | Not graded: purple was the least consistent color across nations in Jonauskaite et al.; test in each market |
Step 2: score each candidate palette (copy this)
Score every candidate 0, 1 or 2 on each line. A palette passes with 9 or more out of 12 and no zero on line 4.
| # | Criterion | 0 | 1 | 2 |
|---|---|---|---|---|
| 1 | Personality fit: does the primary hue support the Step 1 dimension? | Contradicts it | Neutral | Matches a graded pairing, or tested well with buyers |
| 2 | Appropriateness: would buyers call it a sensible color for this service? (Bottomley and Doyle) | Most of 5 buyers say no | Mixed | Most of 5 buyers say yes |
| 3 | Differentiation: lay your logo beside your five nearest competitors’ logos | Same hue as 2 or more | Same hue as 1 | Distinct from all 5 |
| 4 | Contrast: primary or accent as text on your main background | Below 3:1 | 3:1 to 4.49:1 (headlines and buttons only) | 4.5:1 or higher |
| 5 | Market check: meaning in every country you sell to | Known negative reading | Not checked | Checked, no conflict |
| 6 | Survives one color: logo legible in black, white and grayscale | Illegible | Legible with a variant | Legible as is |
Line 2 is a five-minute exercise: show five people from your target market two logo mockups that differ only in color, tell them your positioning in one sentence, and ask which color fits a firm like that. It is not a study, but it is the same question Bottomley and Doyle asked.
Worked example: a CPA firm with a Sage archetype
Step 1 points to competence, where blue has the best (still context-bound) evidence. The catch is line 3: navy is the safe default in accounting, so a navy primary will often score 0 or 1 on differentiation once you line up five local competitors. The fix most firms reach is a navy primary (16.01:1 on white, a 2 on line 4) plus a distinctive accent reserved for buttons and highlights, checked at 3:1 or better. Crimson #DC143C would score 2 on contrast; pure orange #FFA500 would score 0 and fail the palette. Our CPA firm visual identity guide has a contrast-checked starter palette and the professional rules that apply to firm names and logos.
How to test color choices without fooling yourself
Brand palette and button color are different tests. The palette is judged once, before launch, with buyer feedback and the worksheet. An accent or button color can be A/B tested, and the sample sizes are larger than most service-business sites expect.
- Test contrast, not hue meaning. The honest hypothesis is “a higher-contrast accent will draw more clicks,” not “red is exciting.” Make the variant pass 3:1 against its surroundings and 4.5:1 for its label text at normal size.
- Measure the outcome you sell on. Track form submissions or booked calls, not button clicks, which is the gap the first commenter spotted in the 2011 test.
- Calculate the sample before you start. At a 3% conversion rate and a 10% relative lift, the A/B testing guide’s worked example needs 53,211 visitors per variant. If you do not know your baseline, compare it with our sourced conversion rate benchmarks.
- Run whole weeks and do not stop early. A few days of traffic does not cover a full weekly cycle, and checking daily then stopping when one color pulls ahead inflates false wins.
- If traffic is too low, do not A/B test color. Ship the accessible, high-contrast version and spend your testing traffic on the headline or the offer instead.
Changing your primary brand color is not a test; it is a refresh or a rebrand, and it touches your logo files, favicon and structured data. Our rebranding guide covers the scope test and the SEO checklist. If you want a second opinion on a palette before you commit, you can book a consultation.
Frequently asked questions
What is color psychology in marketing?
Color psychology in marketing is the use of research on how people interpret color to choose brand, packaging and website colors. Peer-reviewed studies show hue shapes perceived brand personality and whether a color feels appropriate for a product, and that meaning shifts with context and culture. It does not support fixed color meanings or claims that one color makes people buy.
Is it true that 62 to 90 percent of a product judgment is based on color?
The figure comes from the abstract of Satyendra Singh's 2006 Management Decision paper, a seven-page literature review. The body of the paper never repeats the number and cites no study for it, and the paper itself calls much of the industry evidence on color not scientific. Treat it as untraceable and cite experimental studies instead.
What color builds the most trust in marketing?
Some lab studies found blue logos and websites rated more trustworthy, and Labrecque and Milne link blue with competence, but other studies did not find the effect. A 30-nation study found no prominent emotional association for blue. Pick the color that fits your positioning and category, differentiates you from competitors, and passes contrast checks, then test it with buyers.
What is the best color for a call-to-action button?
No color reliably wins. The famous HubSpot test where red beat green by 21 percent ran on one homepage for a few days with about 2,000 visits and reported no significance test, and the author noted red may have won because it contrasted with a green page. Choose an accent that contrasts with the page and meets WCAG 3:1 for the button and 4.5:1 for its label.
Do color meanings differ across cultures?
Partly. A Psychological Science study of 4,598 people in 30 nations found color-emotion associations were highly similar overall, yet a classifier could still identify a participant's nation 34.4 percent of the time. Examples: Chinese respondents also linked white with sadness, and Egyptian respondents did not link yellow with joy. Check meaning in every market you sell to.
What contrast ratio do brand colors need for accessibility?
Under WCAG 2.2 Level AA, normal text needs at least 4.5:1 against its background, large text (18pt, or 14pt bold) needs 3:1, and the visual parts that identify buttons and other controls need 3:1 against adjacent colors. Ratios are not rounded. Logo text is exempt, but brand guidelines do not exempt any other text.
More Growth, Strategy & Sales guides
- What Is a Customer Success Manager? Role, Metrics, and Salary
- How to Write an Elevator Pitch (Structure, Template, and Examples)
- Unique Selling Proposition (USP): Definition, Formula, and Examples
- What Is a CMO? Role, Responsibilities, and Pay
- AIDA Model: Attention, Interest, Desire, Action Explained
- Best Landing Page Builder in 2026: How to Choose
- All Growth, Strategy & Sales guides →