

Global retail media ad spending is projected to reach $200.4 billion in 2026 and $223.4 billion in 2027, growth of 11.5%, according to WARC Media’s Future of Commerce Media 2026 forecast published in August 2026 (The Desk, Bizcommunity). Growth is slowing: excluding Amazon, WARC expects only 9.8% in 2027, the lowest rate it has recorded since it began tracking the market. The fastest adoption is outside the US and China: Forrester expects Europe, Asia Pacific excluding China and Latin America to each more than double by 2030, and in Asia, India is scaling the format fastest at a 16.4% CAGR (Media Partners Asia).
Every number on this page names its forecaster, the edition date and what that forecaster counts. That matters more for retail media than for almost any other channel, because the same year can carry figures $10 billion apart depending on who is counting.
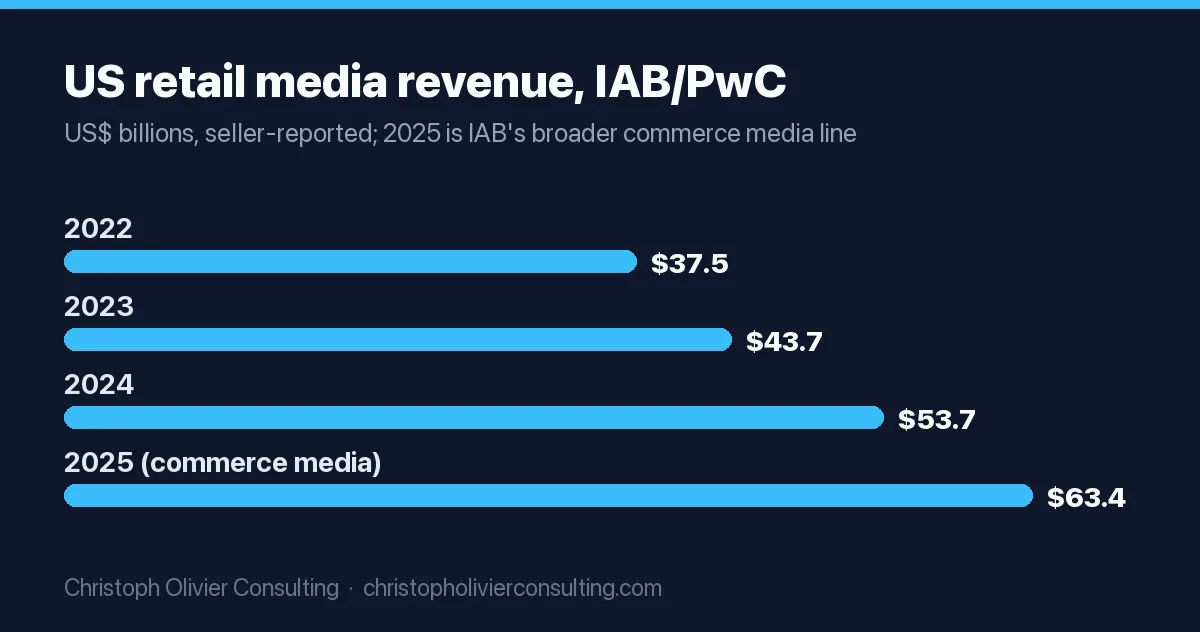
Retail media vs commerce media, in one paragraph. IAB/PwC reported US “retail media network” revenue of $53.7 billion for 2024, a line it placed “within commerce media” (IAB/PwC Full Year 2024, p. 21). For 2025 it reported the wider “commerce media” line instead: $63.4 billion, up 18.0% (IAB release, April 16, 2026). The 18.0% equals $53.7 billion grown to $63.4 billion, so IAB measured growth against the 2024 retail media figure. Quote it as IAB’s stated growth, but say that the label changed, and never call $63.4 billion “retail media.” WPP Media goes further and counts retail, travel and finance media together as “commerce.” Our contextual advertising statistics page uses the same caveat when it sets the IAB format rows side by side.
Projected growth of retail media ad spending: every major forecast, year by year
Four organizations publish a global number that gets quoted. They do not agree, and the newest WARC edition revised 2026 up by $3.7 billion from its own November 2025 edition.
| Forecaster (edition) | What it counts | 2025 | 2026 | 2027 | Longer range |
|---|---|---|---|---|---|
| WARC Media, Future of Commerce Media 2026 (Aug 2026) | Retail media ad investment, worldwide | Not in public coverage | $200.4B | $223.4B (+11.5%); 15.2% of all ad spend | Video on demand to overtake retail media by 2028 |
| WARC Media, Future of Commerce Media 2025 (Nov 2025) | Retail media ad investment, worldwide | $174.9B (+13.7%) | $196.7B (+12.4%); 16% of all ad spend | Above $200B (+11.6%) | Growth was 38.6% in 2021 |
| WPP Media, This Year Next Year (Dec 2025) | “Commerce”: retail plus travel and finance media, sized on media owner revenue | $178.2B (+11.6%); 15.6% of global ad revenue | Not published publicly | Not published publicly | Says commerce faces “pressure to consolidate”; first year commerce passes total TV ($167.4B) |
| Forrester, Global Retail Media Forecast, 2025 To 2030 (Oct 2025) | Retailers monetizing owned traffic and first-party shopper data | $184B | Not in public post | Not in public post | $312B in 2030 (11% CAGR); twice global TV |
Sources: WARC 2026 edition via Mediaweek (Aug 19, 2026) and eCommerceNews (Aug 20, 2026); WARC 2025 edition via Advanced Television (Nov 4, 2025); WPP via its December 2025 report page and Marketing Week; Forrester, Oct 9, 2025. WARC’s full reports are subscriber-only, so the 2026 edition’s 2025 base is not in public coverage.
The growth curve in one line: 38.6% in 2021, 13.7% in 2025, 11.5% forecast for 2027 and 9.8% for everything except Amazon (WARC). Retail media is still growing faster than the total ad market, which WPP Media’s June 2026 midyear forecast puts at 8.9% for 2026 to about $1.3 trillion, excluding US political advertising (WPP Media, June 16, 2026). The gap is narrowing each year.
US retail media: actuals and forecasts by year
| Year | IAB/PwC (seller-reported revenue, actual) | EMARKETER (advertiser spend, Nov 2025 forecast) | WARC (US retail media networks) |
|---|---|---|---|
| 2022 | $37.5B (retail media networks) | n/a | n/a |
| 2023 | $43.7B (+16.3%) | n/a | n/a |
| 2024 | $53.7B (+23.0%) | n/a | n/a |
| 2025 | $63.4B (+18.0%), labeled commerce media | $58.79B | Amazon 78.0%, Walmart 7.5%, all others 14.5% of spend |
| 2026 | Next edition expected around April 2027 | $69.33B (+17.9%) | n/a |
| 2028 | n/a | n/a | $74.9B (+13.6%) |
Sources: IAB/PwC FY 2024 report (2022 to 2024); IAB FY 2025 release; EMARKETER, “Retail Media Ad Spending Forecast and Trends H2 2025,” Nov 5, 2025; WARC via Bizcommunity (US shares are Walrus Intelligence data cited by WARC). The 17.9% is our arithmetic on EMARKETER’s two figures.
EMARKETER adds the concentration story: of the $10.53 billion in incremental 2026 US spend, $9.42 billion goes to Amazon Ads and Walmart Connect, which is over 89% of the new money. EMARKETER has since published a “US Retail Media Ad Spending Forecast H2 2026” report, but its figures sit behind the paywall, so check it before quoting the November 2025 numbers as current. For how retail media fits into total US digital spend, see our US digital ad spend statistics.
Which regions are seeing the fastest retail media adoption
The US and China built retail media. The growth now comes from Europe, India, Southeast Asia, Australia and Latin America, mostly from smaller bases. China is the exception: Forrester says “all regions will gain share at the expense of China.”
| Region or market | Latest figure | Source and date |
|---|---|---|
| Europe | $43B by 2030, more than double today; WARC expects growth to slow to single digits; Amazon takes more than two-thirds of spend in France, Germany, Italy, Spain and the UK | Forrester, Oct 2025; WARC via invidis, Aug 2026 |
| United Kingdom | +18.3% to £4.598bn in 2025; +16.6% to £5.4bn in 2026; 73.9% of UK brands use three or fewer networks | WPP Media via Marketing Week, Dec 2025; WARC, Aug 2026 |
| Asia Pacific (incl. China) | $75.5B in 2026; 36.7% of digital advertising (20.0% excluding China); already twice the size of linear TV | Media Partners Asia, Sept 2, 2026 |
| China | Retail media is 47.7% of digital advertising in 2026, the most mature market, and losing global share | Media Partners Asia, 2026; Forrester, 2025 |
| India | Fastest-scaling APAC market at a 16.4% CAGR | Media Partners Asia, 2026 |
| Southeast Asia | Compounding at 15 to 36% in 2026, depending on market | Media Partners Asia, 2026 |
| Australia | AUD 2.3bn in 2026 (+19.5%), the fastest-growing channel; forecast to pass total TV by 2028 at an 8.4% share | WPP Media midyear via B&T, June 2026 |
| Asia Pacific excl. China | $26B by 2030, more than double | Forrester, Oct 2025 |
| Latin America | $5B by 2030, more than double; LatAm is WPP’s fastest-growing ad region in 2026 (+13% total ad revenue), with retail media cited as a driver | Forrester, Oct 2025; WPP via AdExchanger, June 2026 |
| United States | EMARKETER +17.9% in 2026; WARC +13.6% in 2028; WARC says the US is outpacing Europe | EMARKETER, Nov 2025; WARC, Aug 2026 |
Read growth rates by region with the base in mind. A 16.4% CAGR in India and a 9.8% ex-Amazon global rate are not a contradiction: India is adding percentage points from a small base, while the US and China add the most dollars.
Why retail media forecasts disagree by $10 billion or more
Take 2025 alone. WARC says $174.9 billion, WPP says $178.2 billion, Forrester says $184 billion. In the US, EMARKETER says $58.79 billion and IAB says $63.4 billion. None of them is wrong. They measure different things.
- Scope of “retail.” WPP’s “commerce” adds travel media networks and financial services media networks. IAB’s 2025 line is “commerce media,” not retail media networks. Forrester and WARC say retail media.
- Who reports the dollar. IAB/PwC and WPP size the market from sellers’ revenue (WPP says it uses media owner revenue, not advertiser spend). EMARKETER frames its number as what “US advertisers will spend.”
- Edition date. WARC’s 2026 figure moved from $196.7 billion (Nov 2025) to $200.4 billion (Aug 2026). EMARKETER has already followed its November 2025 report with an H2 2026 edition. Always cite the edition month.
- What sits inside a retailer’s ad line. Amazon’s “advertising services” line covers sponsored ads, display and video advertising, so it is broader than onsite search ads; WARC sizes Amazon’s non-retail ad business (Prime Video, Twitch) at $6.7 billion in 2027. Walmart’s $6.4 billion includes VIZIO connected TV, and Walmart books part of its ad income as a reduction to cost of sales rather than as revenue.
- Onsite vs offsite and CTV. WARC says connected TV is already 23% of retail media spend. A forecaster that excludes retailer-sold CTV will come in lower. Our connected TV advertising statistics cover that overlap.
- Geography and currency. Global totals are converted to US dollars, so exchange rates move the headline without any change in spend. Amazon reports its advertising growth excluding foreign exchange for exactly this reason.
My rule: never put two forecasters in the same sentence as if one updated the other. Compare editions of the same forecaster to show direction, and compare different forecasters only to show the range.
Retail media network financials: revenue, growth and margins from company filings
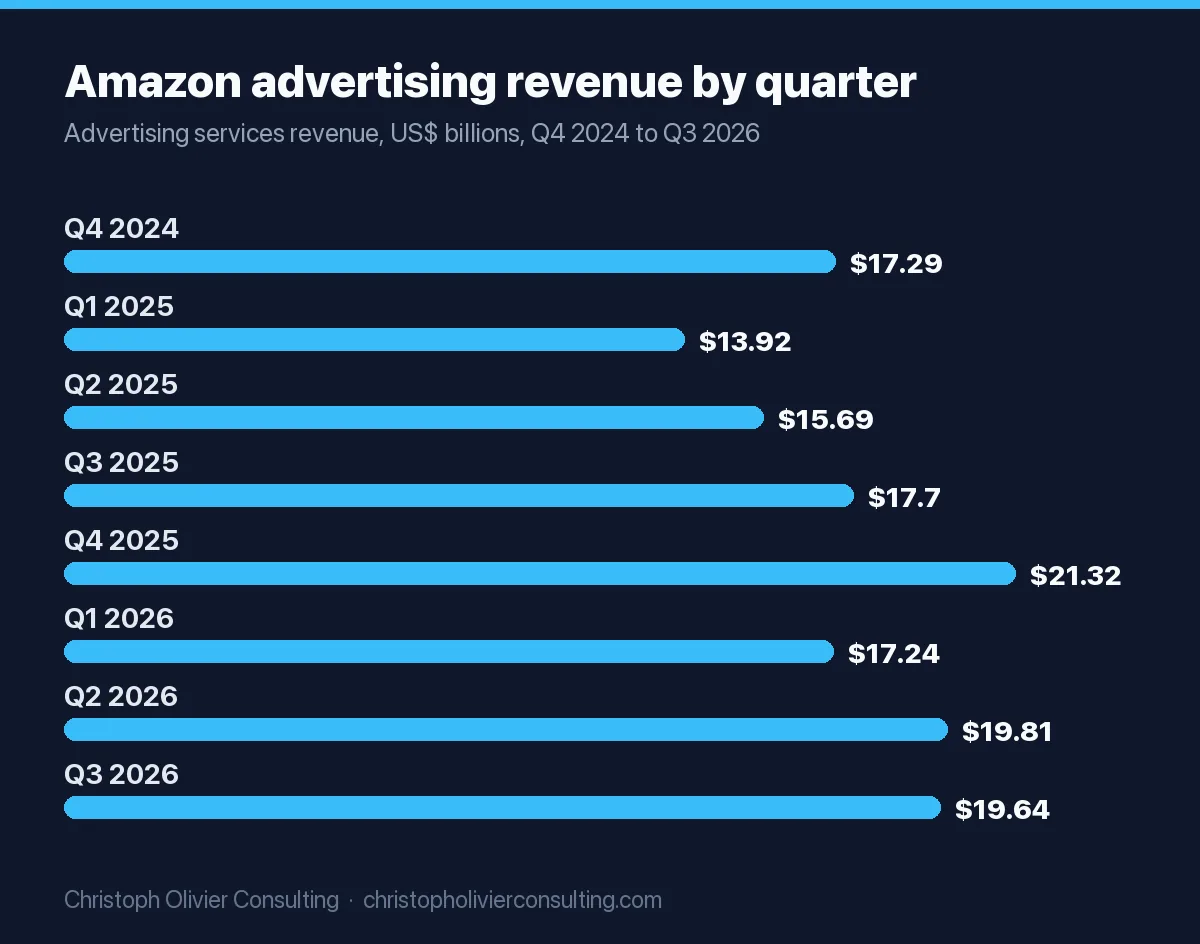
Company filings are the only retail media numbers that are audited actuals rather than estimates. Amazon is the benchmark. It reports “advertising services” every quarter, and the 2026 figures are already in.
| Quarter | Revenue | Y/Y growth excl. FX |
|---|---|---|
| Q1 2025 | $13,921 | 19% |
| Q2 2025 | $15,694 | 22% |
| Q3 2025 | $17,703 | 22% |
| Q4 2025 | $21,317 | 22% |
| Q1 2026 | $17,243 | 22% |
| Q2 2026 | $19,809 | 26% |
| Q3 2026 | $19,637 | 12% |
| Full year 2024 | $56,214 | |
| Full year 2025 | $68,635 | +22.1% reported (our arithmetic) |
| Jan to Sept 2026 | $56,689 | +19.8% vs Jan to Sept 2025 (our arithmetic) |
Sources: Amazon earnings releases filed with the SEC for Q4 2024, Q4 2025 and Q3 2026 (Oct 29, 2026). Annual totals are the sum of the reported quarters.
The Q3 2026 slowdown to 12% is a calendar effect, not a demand break. Amazon says Prime Day fell in Q2 for most large countries in 2026 versus entirely in Q3 in 2025, and it guides to advertising growth “in the high teens” for Q4 2026. Read Q2 and Q3 2026 together: $39.4 billion against $33.4 billion a year earlier, up 18%.
| Network | Latest disclosed figure | Growth | What to watch |
|---|---|---|---|
| Amazon Ads | $68.6B in 2025; $19.6B in Q3 2026 | +22% in 2025; Q4 2026 guided to high teens | Ad revenue was about 9.6% of Amazon’s $716.9B 2025 net sales (our arithmetic; net sales include AWS) |
| Walmart (global, incl. VIZIO) | Nearly $6.4B in fiscal 2026 (year to Jan 31, 2026) | +46% for the year; Q2 FY27 +38%; Walmart Connect US +43% ex-VIZIO; international +20%, led by Flipkart Ads | About 0.9% of $713.2B revenue (our arithmetic), the headroom bulls point to |
| Instacart | $331M “advertising and other” revenue in Q3 2026, 3.1% of GTV | +23% (Q2 2026: $297M, +16%) | DoorDash agreed on Oct 29, 2026 to acquire Instacart at about $17B equity value |
| Uber, DoorDash, Delivery Hero, Instacart | Each runs an ad business worth more than $1bn a year | Not disclosed consistently | WARC, Nov 2025; Uber does not break out ad revenue in its earnings release |
Sources: Walmart Q4 FY26 release (SEC); Walmart Q2 FY27 release, Aug 20, 2026; Instacart Q3 2026 and Q2 2026 releases; WARC via Advanced Television; Uber Q2 2026 release.
Margins. No retailer discloses an advertising margin. What the filings do show is that advertising grows faster than the core business everywhere: Instacart’s ad line grew 23% against 15% GTV growth in Q3 2026, and Walmart’s global ads grew 38% against 5.9% total revenue growth in Q2 FY27. Any margin figure you see for a named retail media network is an analyst estimate, so label it that way.
Retail media ROAS benchmarks for 2025 and 2026
The most-cited public ROAS series comes from Skai, which tracks the advertisers on its platform. Its blended retail media ROAS was $6.00 in Q1 2026, meaning $6.00 of attributed sales per $1 of ad spend.
| Period | Metric | Value | Source |
|---|---|---|---|
| Q1 2025 to Q1 2026 | Blended retail media ROAS | $6.05, $5.89, $6.23, $6.45, $6.00 | Skai Q1 2026 report summary |
| Q4 2025 | Retail media spend growth / CPC | +33% / CPC down 1% | Skai, Jan 27, 2026 |
| Q1 2026 | Retail media spend / CPC / Amazon Sponsored Products CPC | +27% / down 8% to below $1.00 / $0.96 | Skai, Apr 28, 2026 |
| Q2 2026 | Retail media spend; Prime Day blended CPC | +26%; record-low $1.63 | Skai, July 28, 2026 |
| Q3 2026 | Amazon CPC / conversion rate; Amazon DSP CPC; Walmart and other RMN spend | CPC down 16%, conversion down 11%; DSP $0.99 vs Sponsored Products $0.94; +37% | Skai, Oct 27, 2026 |
| Full year 2025 | Amazon: ROAS, ACoS, CPC, conversion rate | ROAS down 3.9%, ACoS up 3.6%, CPC up 4.6%, CVR 13.9% | Teikametrics, Mar 2, 2026 |
| Full year 2025 | Walmart: ROAS, ACoS, CPC, conversion rate | ROAS down about 18%, ACoS up 20.2%, CPC up about 11%, CVR 17% | Teikametrics, Mar 2, 2026 |
Two cautions. First, the two sources disagree on 2025 direction: Skai’s blended ROAS ended 2025 higher than it started ($6.45 in Q4 against $6.05 in Q1), while Teikametrics measured falling ROAS on both Amazon and Walmart. Different advertiser bases, different attribution windows. Second, these are attributed returns, which include sales that would have happened without the ad. For Amazon-specific bidding and ACoS mechanics, our Amazon PPC guide goes deeper.
What is a good ROAS for retail media?
A good ROAS is one above your break-even ROAS, and break-even is simply 1 divided by your contribution margin per sale. Skai’s $6.00 average is a market reading, not a target.
| Contribution margin after product, fees and shipping | Break-even ROAS | Break-even ACoS | Is Skai’s $6.00 average profitable for you? |
|---|---|---|---|
| 15% | 6.67 | 15% | No, below break-even |
| 20% | 5.00 | 20% | Thin margin |
| 30% | 3.33 | 30% | Yes |
| 40% | 2.50 | 40% | Yes, with room to scale |
How brands forecast retail media performance: a worksheet with real inputs
“Retail media forecasting” means two different jobs: forecasting the market (the tables above) and forecasting your own campaign. For your own campaign, forecast from unit economics, not from the market’s growth rate. The worksheet below uses public benchmarks as placeholders; swap in your own account data as soon as you have 30 days of it.
| Line | Input or formula | Example | Where the input comes from |
|---|---|---|---|
| 1. Budget | Your number | $10,000 | Your plan |
| 2. CPC | Benchmark, then your actual | $0.96 | Skai, Amazon Sponsored Products, Q1 2026 |
| 3. Clicks | Line 1 / line 2 | 10,417 | Arithmetic |
| 4. Conversion rate | Benchmark, then your actual | 13.9% | Teikametrics, Amazon, 2025 |
| 5. Orders | Line 3 x line 4 | 1,448 | Arithmetic |
| 6. Average order value | Your number | $35 | Your catalog (example value) |
| 7. Attributed sales | Line 5 x line 6 | $50,677 | Arithmetic |
| 8. ROAS / ACoS | Line 7 / line 1; inverse | 5.07 / 19.7% | Arithmetic |
| 9. Incrementality haircut | Share of orders that would have happened anyway | 30% assumed, so incremental ROAS 3.55 | Your holdout or geo test |
| 10. Decision | Compare line 9 with break-even ROAS | 3.55 vs 3.33 at a 30% margin: marginally profitable | Table above |
Then stress-test the two inputs that moved most in the benchmarks. If CPC rises 11%, as Teikametrics measured on Walmart in 2025, ROAS falls from 5.07 to 4.57. If conversion rate falls 4.4%, as it measured on Amazon, ROAS falls to 4.84. A forecast that only works at today’s CPC is not a forecast. It is a hope.
WARC data points on retail media: what they are and which ones get quoted
“WARC Data Points (Curated)” is a format on warc.com: short, roughly two-minute data items, each built around one statistic, inside WARC’s subscriber platform. A recent example is “Amazon to continue to outpace retail media rivals in 2026” (WARC, Nov 13, 2025), whose body requires a login. The underlying numbers come from WARC Media’s forecasts, and the trade press reprints the headline figures within days. The WARC retail media data points quoted most in 2025 and 2026:
- $200.4 billion global retail media in 2026, $223.4 billion in 2027 (Aug 2026 edition).
- 9.8% growth excluding Amazon in 2027, the lowest WARC has recorded.
- 15.2% of all global ad investment in 2027.
- Connected TV is 23% of retail media spend.
- Amazon, The Home Depot, Macy’s and Walmart each serve more than 20 ads per page on average; Ipsos found memory encoding 47% lower on retailer platforms than in generic offsite environments.
- Retail media takes 55.8% of alcoholic drinks brands’ media investment and 54.9% of food’s in 2027.
- Instacart, Uber, Delivery Hero and DoorDash each run ad businesses worth more than $1bn a year (Nov 2025 edition).
When you cite one, name the edition: “WARC Media, The Future of Commerce Media 2026, August 2026.” Citing “WARC 2025” is ambiguous, because WARC’s November 2025 and August 2026 editions give different 2026 totals.
Which retail media number to cite (or show your marketing committee)
If you need one slide for a board or marketing committee, pick the number that matches the question, and print the source and edition under it.
| The question | Cite this | Do not use |
|---|---|---|
| How big is retail media worldwide? | $200.4B in 2026 (WARC Media, Aug 2026) | WPP’s $178.2B “commerce” figure as if it were retail only |
| How fast is it growing? | +11.5% in 2027; 9.8% excluding Amazon (WARC) | 2021-era growth rates (38.6% in 2021, per WARC) |
| Where will it be in 2030? | $312B, 11% CAGR from 2025 (Forrester, Oct 2025) | A blend of Forrester and WARC numbers |
| How big is it in the US? | Actual: $63.4B commerce media, 2025 (IAB/PwC). Forecast: $69.33B, 2026 (EMARKETER, Nov 2025) | “IAB says retail media is $63.4B” |
| Who wins the dollars? | Amazon 78.0% of US spend, Walmart 7.5% (Walrus Intelligence via WARC); Amazon and Walmart take $9.42B of $10.53B new 2026 US dollars (EMARKETER) | Share figures with no year |
| How big is Amazon’s ad business? | $68.6B in 2025 (Amazon filings) | Round “$70B” estimates when the filing is public |
| Is it performing? | $6.00 blended ROAS, Q1 2026 (Skai platform data), next to your own break-even ROAS | Any ROAS presented as a market-wide guarantee |
| Is Asia worth it? | $75.5B APAC in 2026; India fastest at a 16.4% CAGR (Media Partners Asia) | US growth rates applied to APAC markets |
For the budget side of the same slide, our CMO and marketing budget statistics page sets the IAB revenue totals against Gartner and CMO Survey spend data, with the same retail media vs commerce media caveat. If you want help turning these into a retail media plan with a break-even model for your categories, you can book a consultation.
Frequently asked questions
What is the projected growth of retail media ad spending globally?
WARC Media's August 2026 forecast puts global retail media at $200.4 billion in 2026 and $223.4 billion in 2027, growth of 11.5%, or 15.2% of all ad spend. Excluding Amazon, growth slows to 9.8% in 2027, the lowest WARC has recorded. Forrester projects $312 billion by 2030, an 11% compound annual growth rate from $184 billion in 2025.
Which regions are seeing the fastest retail media adoption?
Outside the US and China. Forrester expects Europe, Asia Pacific excluding China and Latin America to each more than double by 2030. Media Partners Asia says India is scaling fastest in Asia at a 16.4% CAGR, with Southeast Asia growing 15 to 36% in 2026. WPP Media calls retail media Australia's fastest-growing channel, up 19.5% to AUD 2.3 billion in 2026.
What is a good ROAS for retail media?
A good ROAS is one above your break-even, which is 1 divided by your contribution margin: 3.33 at a 30% margin, 5.00 at 20%. As a market reference, Skai's blended retail media ROAS was $6.00 in Q1 2026 after $6.45 in Q4 2025, but that is attributed revenue across Skai's advertisers and includes sales that would have happened anyway.
How can brands forecast retail media performance?
Build it from unit economics: budget divided by CPC gives clicks, clicks times conversion rate gives orders, orders times average order value gives sales. Start with public benchmarks such as Skai's $0.96 Amazon Sponsored Products CPC and Teikametrics' 13.9% Amazon conversion rate, apply an incrementality haircut, compare with break-even ROAS, then stress-test a CPC rise of about 11%.
Is there a 2025 Amazon retail media CPM benchmark?
Not from a public, independent source. Skai's quarterly releases report CPC rather than CPM: Amazon DSP averaged $0.99 per click in Q3 2026 against $0.94 for Sponsored Products, and Amazon CPCs overall fell 16% year over year while conversion rates fell 11%. Treat CPM figures on agency blogs as estimates and check them against your own campaign reports.
Which commerce media networks earn the most ad revenue?
Amazon by a wide margin: $68.6 billion of advertising services revenue in 2025, per its filings. Walmart's global ad business reached nearly $6.4 billion in fiscal 2026 including VIZIO, growing 46%. Instacart reported $331 million of advertising and other revenue in Q3 2026, and WARC says Uber, DoorDash and Delivery Hero each run ad businesses above $1 billion a year.
Why did IAB switch from retail media to commerce media?
IAB's 2024 report showed retail media network revenue of $53.7 billion as a line within commerce media. Its 2025 release reported commerce media at $63.4 billion, up 18.0%, which is the growth from the 2024 retail media figure. The label is broader, so cite $63.4 billion as commerce media, not retail media, and note the change.
Advertising & ad-tech research